What does Lockefox Look For In These Reports?
 |
| re-crunched version from original |
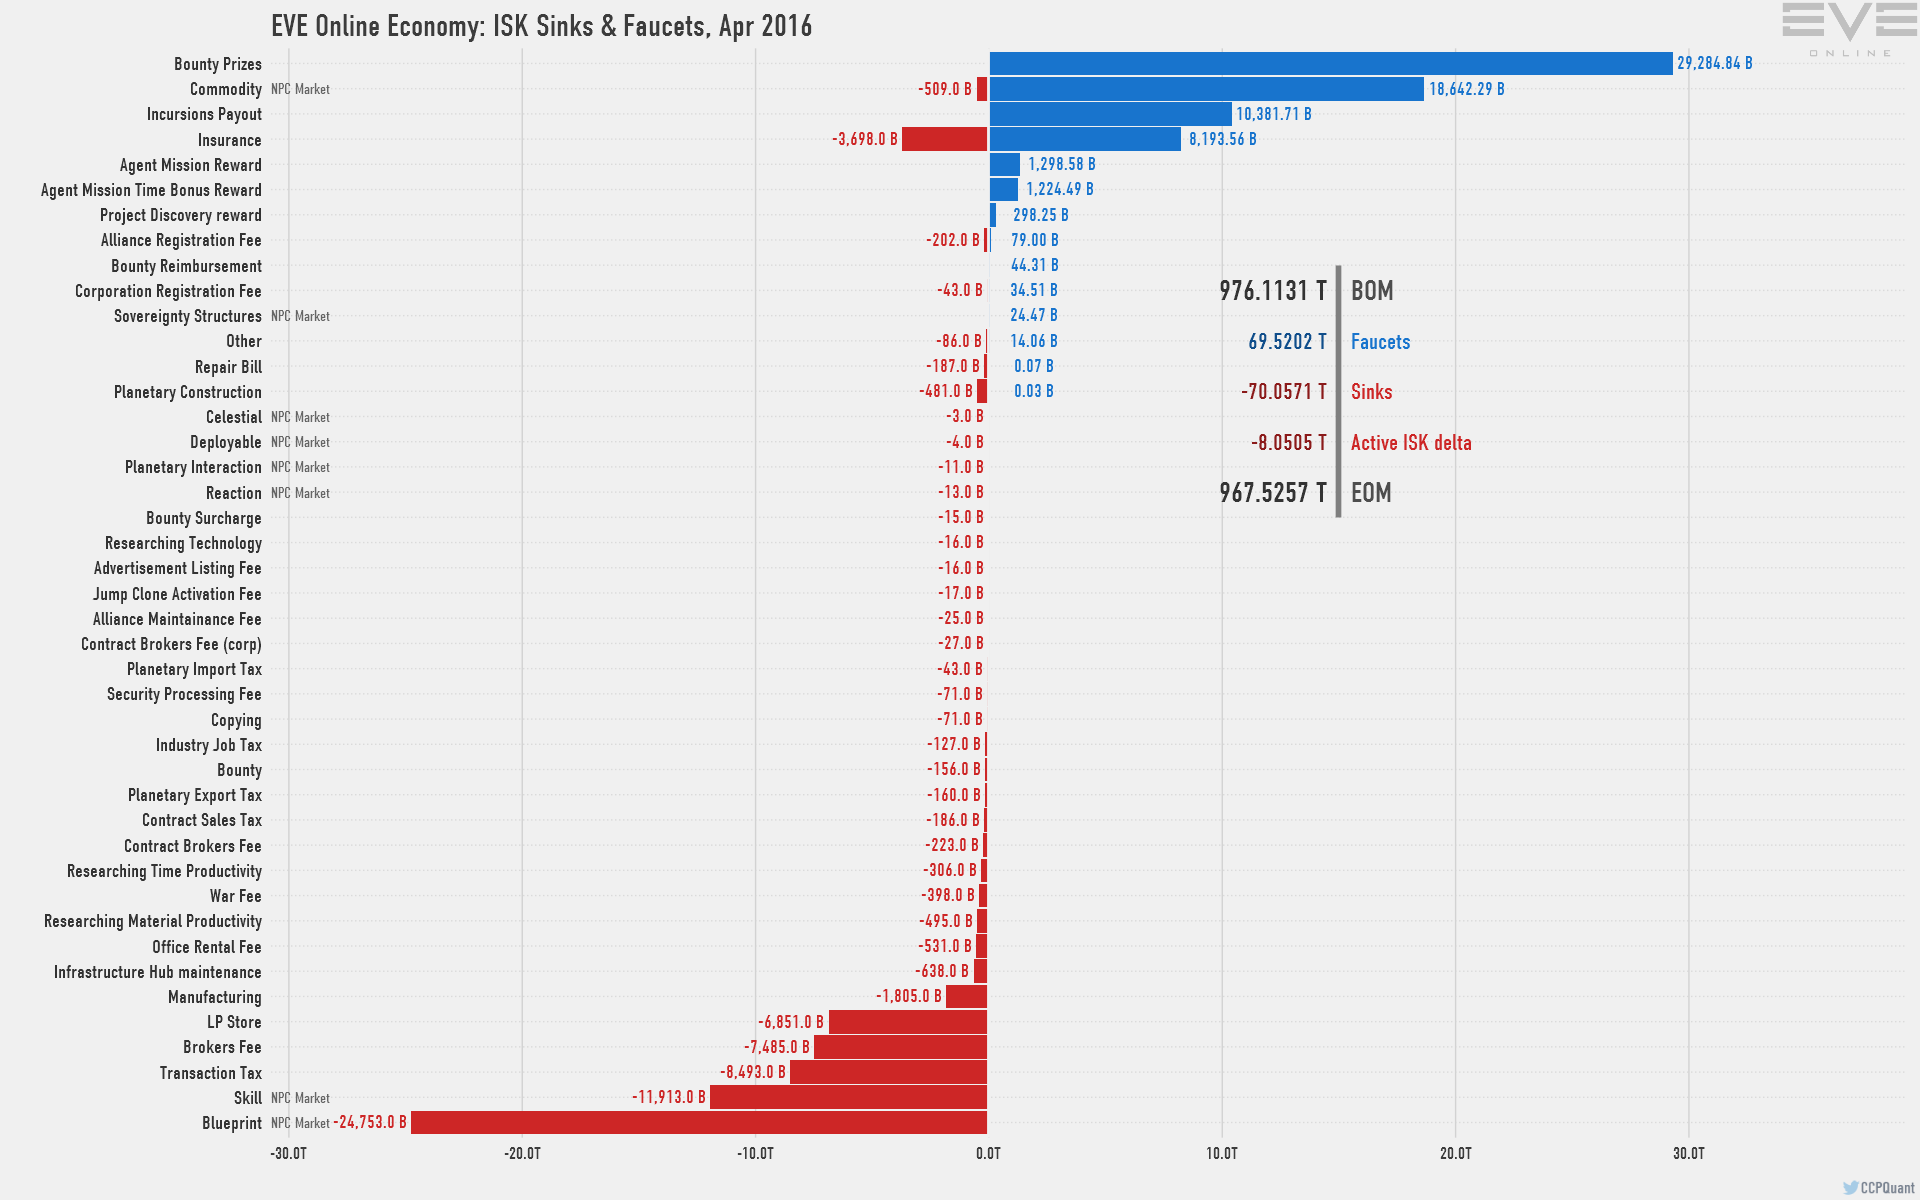
Personally, I've found the period since YC118.2 launched (skill trading) constantly surprising. With one feature, ISK velocities were doubled, and though it would be easy to think that it was just a flash, indicators have remained incredibly strong for several months. I continue to expect precipitous falls in each economic report, and I am surprised every month by just how much activity is out there.
To be an armchair-developer for a moment: ISK velocity stands as the primary indicator I would grade releases and development progress on. Where PVP activity is a decent waterline for some balance changes, World War Bee proves that can be a fickle line to balance against. PCU numbers are another popular open metric, but tend to be extremely noisy and seasonal, and less useful in the long run due to larger trends. ISK Velocity shows more directly cluster-wide activity and patch-performance.
Furthermore, it's a useful metric to explain some of the unprecedented PLEX performance since the start of the year. Looking at total cash supply, it’s very strange to see a protracted period of cash-decline. These coffers will need to be replaced, and though prices may be weak right now, PLEX should rise as balance sheets move back into the black.
April and May's reports show a couple of interesting trends.
First, as Quant pointed out in April's report, it's the first time we've really seen a net-negative balance sheet here; and May continues that trend. And second, the the amount of cash in the Active ISK Delta is particularly high given the launch of the brave-new-world of Citadels. This is probably due to some amount of summer slump, and a healthy amount of fallout from WWB winding down. I'll be interested to see just where Active ISK Delta goes in the longer term.
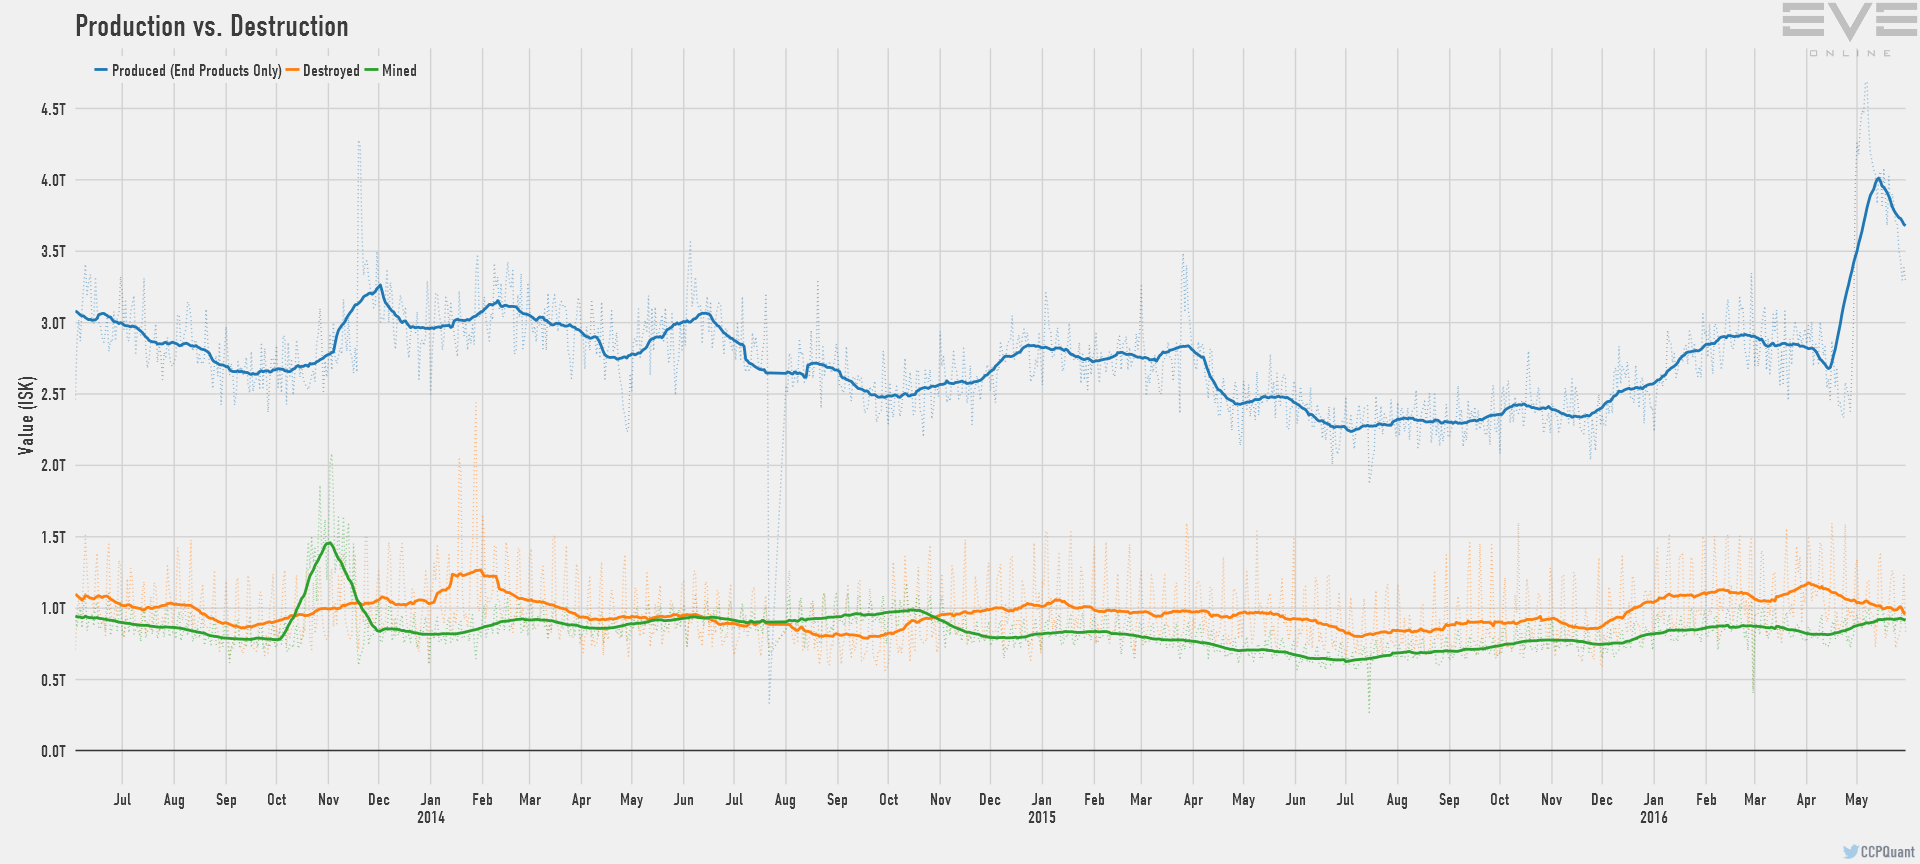
It’s tempting to read the nearly 2 Trillion ISK shortfall as a bad omen, but if you zoom in on the production numbers, you'll see where all that ISK went: Citadels
It's hard to talk about how much impact Citadels will have in the long run yet. I think we need one more month of statistics before we can really see the entire citadel picture solidify. Pair that with the blind-spot the CREST/XML API's have for tracking citadels, and it is extremely difficult to do independent analysis of their rollout.
Other Trends
If I were to peer into my crystal ball for the summer, I would hope we're heading toward a period of stability. Skill Trading, WWB, and Citadels moved so much liquid ISK around, and destroyed a good amount of that cash and material, that I would think many need a period of reprieve to recover from the hangover. Also, the destruction rate for citadels is higher than I expected, so we should still see a somewhat higher clip for material consumption.
I originally pointed at PLEX and figured we would start slowly swinging the balance back, as people move to refill their coffers, but sales and general instability have dropped the price again from 900M to 850M. I do expect a hot fall/winter after this summer, so it would be an excellent chance to recuperate and prepare for new changes and territory battles in the most valuable pieces of space.


1 comment:
The one part of the May report i found interesting (i.e. odd) was that Trade fell 14%. Perhaps due to WWB winding down or perhaps due to Citadel material buying being done in April (Trade rose 1%) or perhaps because the report does not pick up on the trade done in Citadel markets.
However, with an increase in Imports and Exports in The Forge (and generally) and a rise in Production and Mining, and a rise in Bounty payments (=ratting) then i would have expected Trade to also rise.
Post a Comment