Showing posts with label code. Show all posts

Monday, April 17, 2017

Aspiring Hari Seldon - Part 3 - Releasing REST Forecasts

Check out part 2

After playing with Prophet, I wanted a way to distribute the data more publicly.  I could have just incorporated it into our R templates and made it part of the show, but I felt like that was unfair to the general public.

(Though it required a ground-up rework) I used the Flask Restful app we were providing for EVE Mogul.  Though this turned out to be a complete rewrite, I learned a lot about Flask and testing to make things go.

What They Don't Tell You

One of the biggest pains of self-teaching is it's very easy to learn enough to be useful, but not enough to be good.  And the Flask documentation is particularly bad about giving up the barebones of what does what, but totally forgets to sell a viable project shape, leading to a lot of pain later.

Since the original OHLC feed was based loosely off a work project (as a way to test out corners on my own time), it repeated a design flaw.  Turns out there's a very particular Flask shape, and deviating from it causes a lot of problems.  

Some examples to avoid pitfalls:
By using the prescribed Flask structure, all the pieces from launcher to test make a lot more sense.  Particularly, testing was one of the more difficult pieces of the picture.

About The Endpoint

Because of the CPU-intensive operation of running predictions, I wanted to incorporate two features:
  • API keying
  • Caching
Though I'm happy to share the source, and open up to the community, I'm not ready for full-hog release.  TL;DR: There are a couple of Flask eccentricities, and gdoc integration could cause some serious issues.  Also, uncached performance can run north of 15s, which could cause issues for some platforms.

To help get around "walled garden" accusations, I've done a few things:
  1. I've left copious notes and automation on how to deploy the service on your own webhost
  2. I've provided API keys to some other market devs such as EVE Mogul and Adam4EVE
  3. I am happy to distribute keys on-request to other devs
The goal is to get the content out to the widest audience possible, even if the raw data is a little unwieldy.  And due to my limitations as a developer, this is my compromise.  

Predictions In The Wild

Adam4EVE


Though my API service is designed to give you soup-to-nuts everything you need to plot in the REST payload, Ethan02 over at Adam4EVE added his own DB to keep us honest.  I totally love this!  As of right now, it's still in their DEV branch, but expect to see more from them soon!

EVE-Mogul


Extending the existing OHLC candlestick plot, EVE Mogul will let you keep close tabs on what you're currently trading, and this is an excellent chance to gut-check your investments.

Conclusions

Check out the source: ProsperAPI

I didn't get to share all the other super-nerdy #devfleet stuff (like travis-ci integration, or PyPI release).  I will probably try to release more notes on python stuff directly on Medium going forward.

This was an eye opening project in a lot of ways.  This opens the door for more micro-service REST stuff in the future.  Also, I do plan to have the PLEX split covered before CCP releases it on May 9th.

Thursday, March 2, 2017

Aspiring Hari Seldon - Part 2

Been quite a while, but I have a follow up to this old post.

A Crash Course

Tinkering with prices is difficult, and most players may not understand why.  Though we all interact with the price of things, unspinning the mess of how and why becomes complicated fast.  

What's worse, the price of a thing doesn't follow traditional fitting tools, it's a collection of ups-and-downs day-to-day.  It's a solution to a complicated network of factors.  This is why I've had so much trouble designing forecasts; because starting point is critical, and the walking methods aren't strictly obvious.

After dancing around this problem for as long as I have, I've come up with a few best-practices for approaching Prosper's economic reporting:
  1. Make it normal or linear: hard math is hard, keep analysis as simple as possible
  2. Figure out connections: storytelling can quickly connect seemingly disparate points
  3. Assume players aren't dumb: everyone is trying to win
  4. Look for disproof: try to eliminate weaknesses and errors in tools

Prophet - A New Crack At Forecasting

My boss sent me a link to Prophet.  And, of course, I threw EVE data at it!
On the one hand, that PLEX prediction is pretty hilarious, while on the other, the injector forecast is very close to one I'd publish on the show.

So, what is going on here?  I still think we're running into the issue of putting linear-style modeling on a non-linear problem, but we're getting much closer to the gut-version I would like to illustrate on the show.  

What's more, we can use a previous lesson and use the forecaster to predict the day-to-day volatility as a second opinion.  Using a GBM-style method, we get this:
Getting a second opinion in this case is a good way to counteract the problem of runaway models; forecasts that get stuck in a runaway up or down swing.  Though it's not fool-proof, we're reaching a "good enough" level to actually start considering it in our tooling.

Let's Go!


As promising as these initial findings are, I still worry they aren't a good replacement for more robust methods.  I'm still investigating the following:
  1. Single-dimension: only using price data, not including volume for supply/demand accounting
  2. Limited test scope: only run on CREST history data, not extended history data yet
  3. Time series rigidity: designed for daily data
  4. No extended grading done: need to test predictions vs reality
But the future is promising.  There are some key features I'm loving in this library:
  • Built-in changepoint trending: predicting discontinuities is very powerful
  • Python/R library parity: easy development/testing
  • Built-in week/month/season accounting
  • EXTREMELY FAST
There's so much more to play with, and I'm excited to dive deeper.  I'm looking into including these forecasts sparingly into the Prosper show going forward, as a better way to illustrate my gut feelings.  And hopefully we can incorporate these forecasts in a more robust feature in the near future!
TypeNames redacted while debugging


Subscribe on Twitch and YouTube

Thursday, October 27, 2016

Favorite Python Packages 01 - Making a chatbot

I had to write a logging handler for work that pushed errors up to HipChat. Turns out the process was so easy, I could not resist adding a chat-handler to ProsperCommon (esp given my hacky email handler). Despite my love for Slack, Discord became the tool-of-choice because it’s easy to stand-up/tear-down chats with a lot of flexibility. I also skipped Slack for now because the tweetfleet server blows past the 10k message buffer on a daily basis.

So, let's cook up a chatbot! Discord's API offerings are dizzying; this should be easy!

Discord.py - Making Chatbots Easy

Since Discord relies on an oAuth2 connection, and chats are inherently asynchronous, cooking up a bot from scratch would hurt. Discord.py to the rescue! This library has exceptional API coverage and is easy to use.

My one gripe is the documentation. Docs are sparse in places, but I'll forgive that sin with their example code and an active community on the Discord API Guild. Also, I had some trouble getting off the ground with the Discord API docs. Specifically, getting the correct tokens required to work, but once the bot was authenticated, it was off to the races!


TinyDB - The Easy Object-store

Pinging the internet for data is not free; whether because of rate limits or round trip times. Tools like SQLite are great for lightweight/portable data storage, but also requires schema design. MongoDB is a powerful noSQL solution, but is heavy to stand up (and I'm not in love with the query language). TinyDB comes to the rescue as a way to get the JSON/noSQL storage of MongoDB with none of the server/auth standup.

This shines when paired with REST endpoints. It's easy to push/pop entries around and keep the same raw JSON in archive as what's coming from the endpoint. Also, it's as easy as JSON to add more keys for searching. I'm still not in love with my cache-timer implementation in ProsperBot, but fetching from cache is 100x faster than an internet-call. Lastly, debug is easy since output is raw JSON, though this could lead to compression issues down the line.


Quick pro-tip about TinyDB: get ujson. This pure-C implementation of the JSON library is a great drop-in replacement. It can also be baked into libraries like Requests. ujson makes handling JSON lightning fast! Also, TinyDB has a wide array of extensions, and I will be looking into MongoDB hooks at a future date.

NLTK - Processing Text Made Easy

The number one problem I have with stock quotes: it takes 2-3 extra clicks to figure out WHY the price moved for the day. Google/Yahoo/etc provide great single-stock pages that give news summaries, but when you open a ticker or phone widget, only the raw numbers are reported. If I'm going to make a quote bot, why not include some information and save people a search?

The good news, Google/Yahoo both give a by-ticker API of relevant news articles. The bad news, they yield 10-15 articles in the query. Furthermore, the data isn't particularly ranked/scored from the source. I could have gambled with first-article being the best, or stacked a publisher priority order, but all I wanted was:
Good news when the stock is up.  Bad news when the stock is down
NLTK to the rescue. I have wanted to try my hand at sentiment/language analysis since I saw a local talk on Analyzing P2P Lending Data. Putting headlines through the vader_lexicon tools did exactly what I wanted and was blazing fast.

After playing with this quick demo of NLTK, I'm excited to expand this toolset.  If I can find the time, I'd very much like to write up a new discord bot for grading a community and highlighting troublemakers statistically rather than bluntly using block lists and word black-lists.

Let's See It!


I'm going to save the "how to get [stock] data" question for another blog.  There's a wide world of API's and support out there, and digging into them is worth a whole blog.  For the impatient, I used these two articles as a springboard to get started:
Though designing the bot language may require some creative design for EVE topics, standing up the bot should be easy.  I've been able to add functions at a uniquely fast pace (0.5-1d/feature) and standing up the whole bot took just a few evenings once I got through the roadblocks.  The libraries above are excellent tools to have in your tool box, and I'm excited to dig deeper into their functionality beyond the small `hello world` functions written so far!

Tuesday, October 18, 2016

Up And Down - Maintaining a OHLC Endpoint and Deploying Flask Restful


This is the first part of a more technical devblog. I will be writing up more specifics in a part 2, but I wanted to talk about the ups and downs behind the scenes with our EVE Mogul partnership. Issues are mostly my failings, and Jeronica, Randomboy50, and the rest of the team have been amazing given my shoddy uptime.

Prosper's OHLC Feed

I forgot to blog about this since the plans for Prosper's v2 codebase have only recently solidified, but we have a CREST markethistory -> OHLC feed hosted at eveprosper.com. The purpose was to run Flask/REST through its paces, but Jeronica over at EVE Mogul whipped up a front-end and Roeden at Neocom has been using it in their trading forays.

SSO Login Required To View

This originally served me well as a learning experience, but keeping a REST endpoint up isn't as simple as originally expected. From Flask's lack of out-of-the-box multithread support, to some more linux FUBAR's below, it's been a wild ride. And now that players are legitimately counting on this resource as part of their toolchain, I figured it's time to get my act together.

The Litany of SNAFUs

What really brought the house of cards down was our move from a traditional hosting service to a full r/homelab solution. Prosper has been living besides some other nerd projects (minecraft, arma, mumble, etc) and this move gets Prosper off the shitlist from the other customers when Wednesday night rolls around and I hammer box generating the show's plots. Unfortunately, for the added performance, we trade being under a benevolent tinkerer; restarts and reconfigs are more common than before. It's a huge upgrade, and I can't thank Randomboy50 enough for the support, but nothing is truly free (except the minerals you mine yourself™).

#nofilter #bareisbeautiful


This need for stability runs headlong into a shitty part of python: package deployment. Though wheeling up and distributing individual python libraries is easy, deploying python as a service is not. There will be a second blog on the specifics, but you're largely stuck with magic-project-deploying scripting out of the box, which can get really hairy if you're not careful about virtualenvs.

Thankfully, work turned me on to dh-virtualenv and though now we're grossly overengineered with a service .deb installer, we now have a properly deployed linux service that should be far more robust going forward. It does mean that there's now "build" and "deploy" steps for updates, but now that we're tied into systemctl the endpoint should be much less likely to go down.

With the last few months of work, I still expect a large amount of reengineering in our quest for a Quandl-like EVE service, but with the installer built in we can upkeep the endpoint with a lot less effort going forward. We are still behind on the ProsperWarehouse rollout, getting scrapers rewritten, but those modules should be a cakewalk to deploy now with ProsperAPI properly built up.

Also, I've worked in a discord logging handler which will be useful for monitoring, but notes on that later ;)

Friday, September 23, 2016

ProsperWarehouse - Building Less-Bad Python Code

EVE Prosper is first and foremost a data science project.  And though hack-and-slash has got us this far, we need to consider a proper design/environment if we want to actually expand coverage rather than just chase R/CREST/SQL bugs.


There has been some work moving Prosper to a v2 codebase (follow the new github projects here) but ProsperWarehouse is a big step toward that design.  This interface should allow us to open up a whole new field of projects, so it's critical nail this design on the first-pass before moving on.

What The Hell Is This Even
Building a Database Abstraction Layer (DAL).  

Up to now we have used ODBC, but there are some issues with cross-platform deployment, and database-specific weirdness that have caused issues: such as ARM and MacOS support being painful.  Furthermore, relying only on ODBC means we aren't able to integrate non-SQL sources like MongoDB or Influx into our stack without rewriting huge chunks of code.  Lastly, we have relied on raw-SQL and string-hacks sprinkled all over the original codebase, making updates a nightmare.

There are two goals of this project:
  1. Reduce complexity for other apps by giving standardized get/put methods.
  2. Allow easier conversion of datastore technologies.  Change connection without changing behavior
By adopting Pandas as the actual data-transporter, this means everything can talk the same talk and move data around with very little effort.  Though some complexity will come from cramming noSQL style data into traditional dataframes, that complexity can be abstracted under the hood and always yield the same structures when prompted.

How Does It Work?
The Magic of Abstract Methods

I've never been a great object-oriented developer, and I've been especially weak with parent/children relationships.  Recent projects at work have taught me some better tenants of API design and implementation, and I wanted to apply those lessons somewhere personal.  


Database Layer

Holds generic information about the connection; esentially the bulk of the API skeleton.  Whatever Database() defines will need to be filled in by its children.  This container doesn't do much work, but acts as the structure for the whole project under the hood.

Technology Layer

Right now, that's only SQLTable(), but this is designed to hold/init all the technology-specific weirdness.  Connections, query lingo, test infrastructure, configurations.  This is supposed to be interchangeable so you could pull out the SQLTable and replace it with a MongoDB- or Influx-specific structure.  This isn't 100% foolproof with some of the test hooks the way they are built in right now, but by standardizing input/output, conversion shouldn't be a catastrophe.

Datasource Layer

A connection-per-resource is the goal going forward.  This means we give up JOIN functionality inside SQL, but gain an easier to manage resource that can be abstracted.  All of the validation, connection setup/testing, and any special-snowflake modifications go to this layer.  Also, because these have been broken out into their own py files, debug tests can be built into __main__ as a way for humans to actually fix problems without having to rely on shoddy debug/logging.

This adds a lot of overhead for initializing a new datasource.  In return for that effort we get the ability to test/use/change those connections as needed rather than going up a layer and fixing everything that connected to that source.  It's not free, but should be a cost-benefit for faster development down the line.

Importlib Magic

The real heavy lifter for the project isn't just the API object design, but a helper that turns an ugly set of imports/inits into a far simpler fetch_data_source() call.  I would really like to dedicate a blog to this, but TL;DR: importlib lets us interact with structures more like function-pointers.  This was useful for a work project because we could execute modules by string rather than using a "main.py" structure that would need to import/execute every module in-sequence.  This should make it so you just have to import one module and get all the dependent structure automagically.

Without importlib, every datasource would have to be imported like:


Instead now it can look like


A small change, but it should clean up overhead and allow for more sources to be loaded more easily.  Also, this does mean you could fork the repo and build your own table_config path without going crazy trying to path everything.

A Lot Of Work For What Exactly?

The point is to simplify access into the databases.  With a unified design there, we can very easily lay the groundwork for a Quandl-like REST API.  Also, with the query logic simplified/unified, writing direct apps to both fetch/process the data go from 100+ lines of SQL to 2-3 lines of connection.  

By abstracting a painful piece of the puzzle, this should make collaboration easier.  This also buys us the ability to use a local-only dummy sources for testing without production data, so collaborators can run in a "headless mode".  Though I doubt I will get much assistance on updating the Warehouse code, it's a price worth paying to solve some of the more tedious issues like new cron scripts or REST API design with less arduous SQL-injection risk/test.

Friday, August 19, 2016

Switching to Sublime - #DevfleetFriday

This isn't strictly EVE related, but Talk Python To Me has inspired me to post some more dev/meta related content.

To those who have worked with me on code, you'll know at least two things:

  1. I'm a total luddite when it comes to adding helpful tools to my belt (IDE's specifically)
  2. I live and work in Windows when I can
But my new job has me working in Mac and Unix far more often, so my favorite editor Notepad++ is out.  After touring editors and IDEs for a replacement, I have settled on my new home: Sublime 

Sublime New World

"Why Sublime?" was a pretty easy question for me to answer: very cross-platform, and a deep utility library.  In fact, I've pointed my configs at dropbox so I can easily work in the same Sublime across machines.  Also, the cross-language formatting profiles are pretty slick, and was able to get things working the way I wanted without too much pain.

But Sublime really wins with its Package Control.  Nearly anything you would want can be added to the editor in just a couple commands.  And by-and-large, they're easy to set up and use right out of the box.  Also, many of the packages I've dug into are mostly python, so it's been easy to fix small bugs.

Personally, SublimeLinter has been the best thing to happen to my code recently.  Though it took some effort to get working with python3 on the Mac, having the tattle-tale highlights for bad code and bad practices has me writing far more consistent code.  Writing a .pylintrc file is a little obnoxious, and it doesn't validate virtualenv packages (only ones installed in main site-packages), once it's configured it's a real godsend for keeping my code in line.

My one knock against the platform is the need to memorize a large number of shortcuts that aren't inherently obvious.  There are some really slick tricks in the arsenal, but it feels very VIMy to have them handy

Things I Miss From N++

Search Highlighting

N++ has this amazing multi-color highlighting tool that makes traversing large or complicated code blocks easy.  Word Highlight is an okay replacement, but it doesn't do multi-highlight the way I'd like.  

Project Searching

Another very slick N++ feature is its extended search.  Able to quickly see results, contexts, and previous searches in a docked pane was another useful tool I miss having.  Sublime has an extended search, but it pops open in a new document, and doesn't easily fold the way N++ does.

Multi-Pane Interface

This is a total nitpick.  Sublime absolutely does have multi-pane views, and they are actually a step up in the aggregate.  But my one complaint is duplicating a file isn't really obvious.  The "New View Into File" command isn't mapped, and I'd rather r-click a tab and send to pane.

Free or Fee?

My one complaint about Sublime is its licensing.  Though it has a winrar-type "free forever*" mode, it complains semi-randomly at save-time to purchase a license.  At $70, I think the fee is a little steep given how much competition is out there, and its key method (RSA hasn?) is not super intuitive.  

I'm not at all against paying for a thing, but recently many enterprise services have really stepped up their game and spoiled me with their set-and-forget memberships.  Services like XSplit and Adobe just work, and though I pay pretty handsomely for the memberships in the long run, I'd almost rather buy Sublime through a Patreon model.  At the absolute least, I would like an account auth primary key, even if the current key method works as an offline backup.

Monday, August 8, 2016

The Slow Summer - July Economic Report

It's been a busy summer, despite the hiatus.  The latest Economic Report numbers were particularly weak, and I was considering skipping the month.  But MarketsForISK has been publishing some serious articles and Delonewolf over at EVE Talk posted a review.


Though my fellow pundits took some serious dives into the data, I'd like to counterpoint with a more brisk review.  Be sure to check them out if you want more depth, but let's take a more general look at the stats.

Tell Me What You See

Ohboy, though last month's review was largely positive, thanks to "better than expected" activity metrics from the Serpentis event, July crashed down hard.  The month-to-month sinks and faucets chart was particularly troubling.


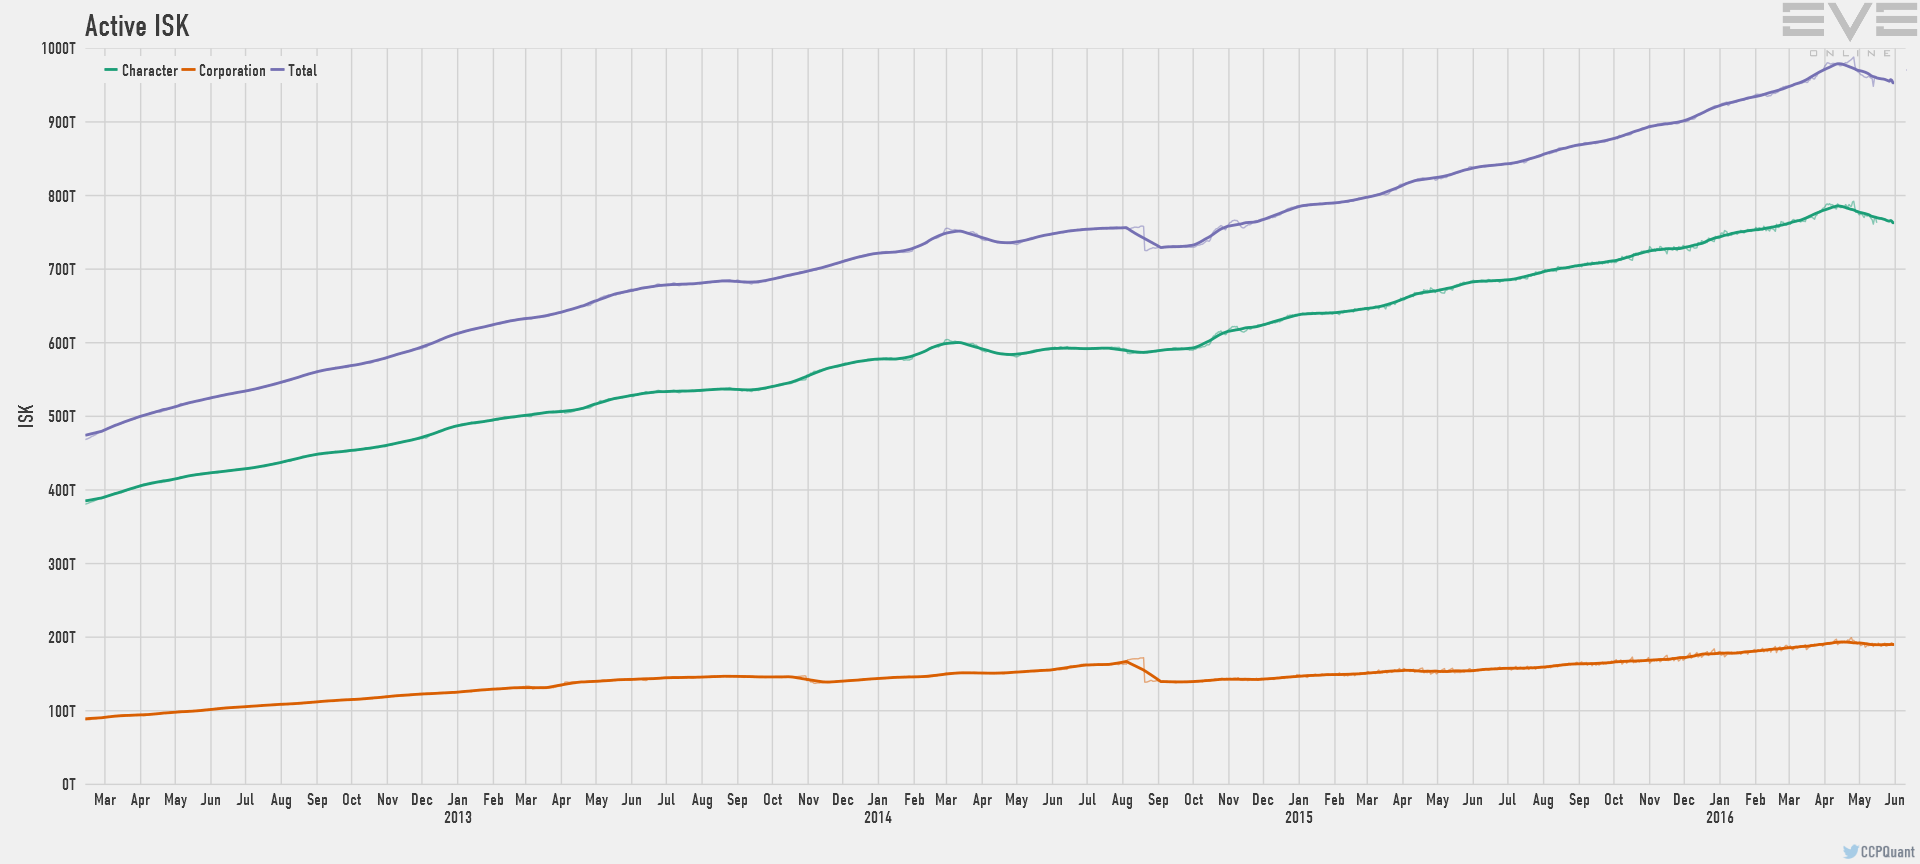
Though specific ISK sink/faucet numbers are in-line with the expected baseline, the Active ISK Delta (money leaving through inactive accounts) is worrying.  June's retraction was expected (WWB + Citadel) but July keeping up the trend is what concerns me.  Pair this with my favorite stat, ISK Velocity, and we're seeing a much harder retraction than I originally expected.


With the latest Blog Banter stirring the EVE Is Dying pot, these numbers could validate those looking to catastrophize.  I would not be so hasty to eulogize though.

Finding The Light

I don't think the numbers are all bad.  Looking at the net-trade and PVP stats, things are still pretty positive.  Are they breaking any records?  No.  But the activity is high enough to to be "normal" without having to panic.

NOTE: August dip due to database issue

Most market watchers have focused on the month-to-month net trade statistics (down 10-15% each month), but I've avoided them because I think they're a bit of a red herring.  For one, Feb-May numbers are much higher-than-average due to a series of effects all running together; so cooling should be expected.  Secondly, I think just talking about total-trade isn't as useful as splitting it up.  My analysis chops up the RMT markets (which make up a significant portion of the pie) and let us focus on the pieces.  This way we can see how each is moving to color the whole picture.

Material trade continues to be a hot market.  Those that are active in the game are still getting their content.  Also, as I've been saying since the last o7 show, it's an excellent time to be generating cash.  PLEX prices have only just recovered to the 1B mark (thanks to the AT auction).  The slump in the ship trade has me worried, but looking at the PVP statistics, it's hard to figure out what exactly is going on with PVP stats staying even while ships traded falls.


Lastly, we're still not quite seeing the cash-recovery I was expecting though, so there is still a lot of work left to be done to get back to truly normal levels.

Drawing Conclusions

It's easy to catastrophize in the summer.  Numbers tend to slump most at the end of July, campaigns slow, and CCP's news crawls through July/August due to vacation time.  I still believe there's enough on the plate this fall to be excited about, that as long as people don't get too bitter, there will be content to come back to once vacations end.

Looking externally, No Man's Sky is probably going to make the August numbers particularly bad.  Though, I do expect it to have a positive effect in the longer term, reigniting the hard-scifi spark that only a few games can, and perhaps bringing some contingent back for nostalgia.

If I may dip into Blog Banter territory and editorialize: it's a terrible time for picking out trends.  With the seasonal ebb and flow is at it's lowest point, drawing a line between June/July numbers would be Fox News grade cherry picking (o/ Sion).  Though I personally share a lot of Sugar Kyle's feelings of IRL vs EVE, and have been drifting more and more away from active play into a devfleet/metagame kind of role; like Jonny Pew, I just cannot drop the game entirely.  Is EVE going into a new chapter?  Absolutely.  Dying?  MMO's are dying, but I don't think EVE is doomed yet.

Wednesday, July 13, 2016

Beating The Heat - June Econ Report

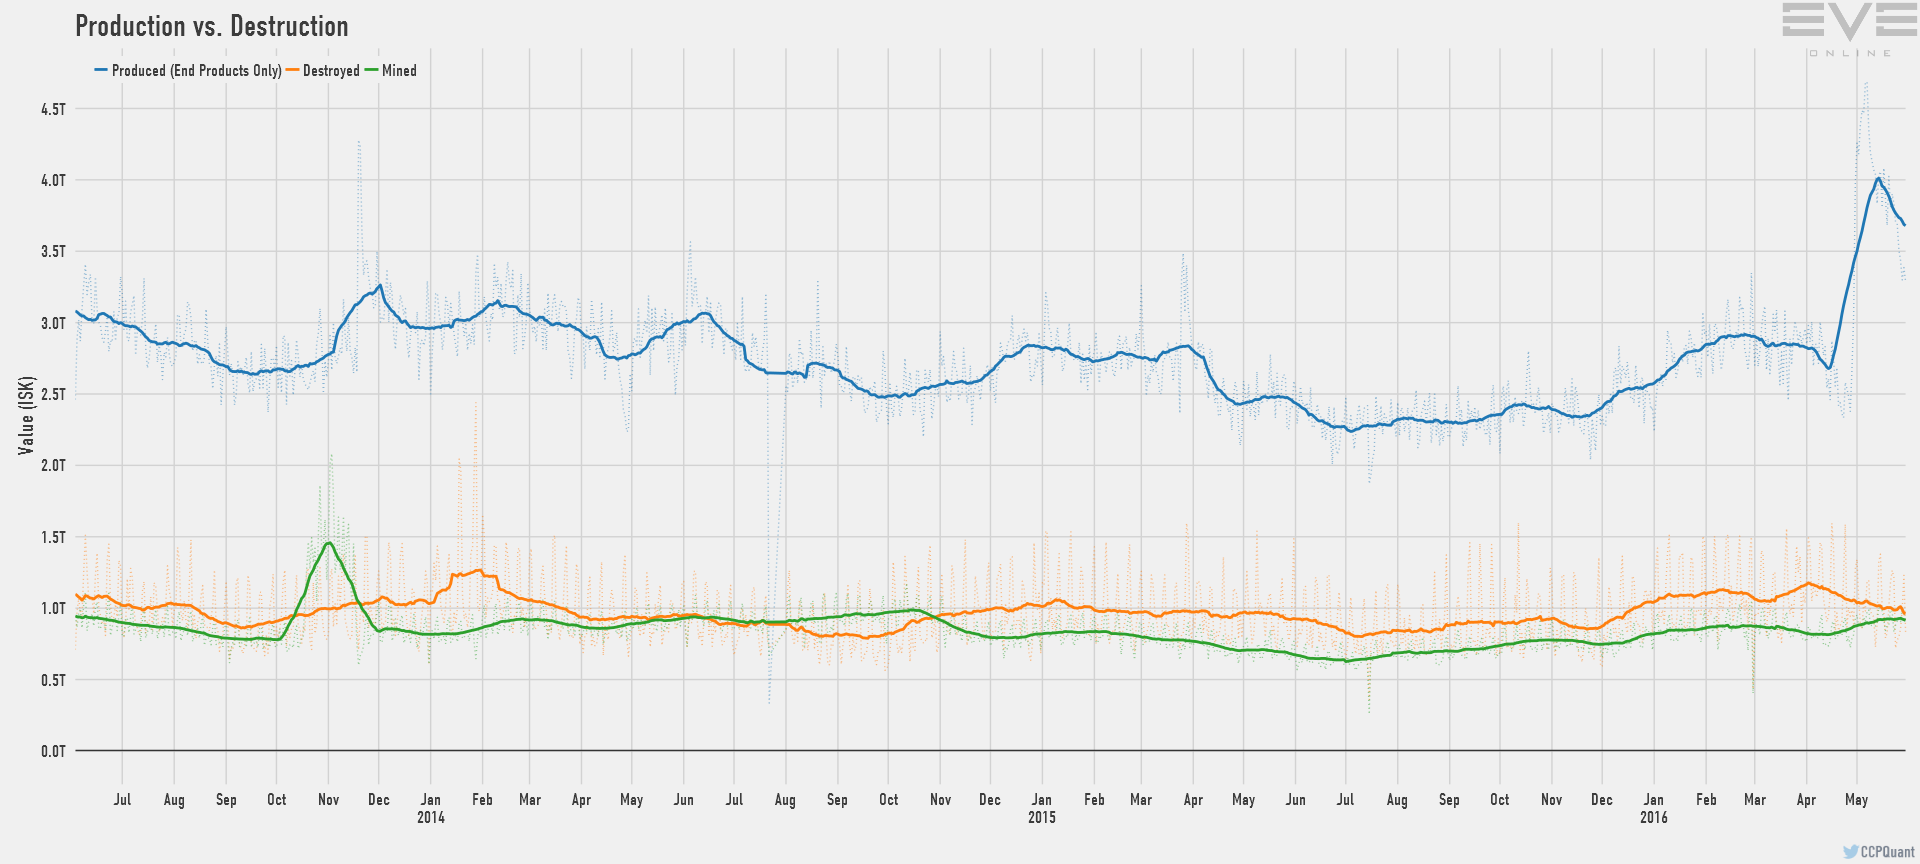
CCP Quant continues to deliver the economic data.  June data released last week, and though summer is traditionally quiet, let's see if the data bears that out.  We did release our own market summary for the o7 show, but Quant's numbers released a good week after that show


ISK Velocity

As I said in last month's review, ISK velocity is the first stat I jump to.  I have this hope that ISK velocity will be useful in building better PLEX forecasts, and it's a good market activity metric to pair against PVP numbers.  Now with the benefit of hindsight, it's a little easier to draw the correlation between ISK velocity and PLEX direction.  With things cooling to a new normal level, I'm looking forward to tempering expectations a little better going forward.


When it comes to PLEX's record slide over the spring, it's useful to picture ISK velocity and PLEX prices together.  February had skill trading release, March/April had World War Bee, May had Citadels.  In this historic period of cash demand, PLEX (like gold) acts as an easy way to get at that liquidity.  With big door-busting features calmed down for the summer, I'm happy to see ISK velocity staying strong (~0.7) vs pre-skill-trading levels.

Small Note for the stats nerds: Quant's report uses a bi-directional 30d moving average to calculate ISK velocity.  I would rather use one that only looks backwards.  Will probably tweak the stat slightly going forward, which will take us out of alignment with Quant's official charts.


When it comes to activity statistics, I'm actually surprised how well June did in aggregate.  Though we're seeing a general cooling, we're actually above the points I originally spitballed.  Specifically, the slight uptick in value destroyed is interesting.  I'm not ready to pin this entirely on the new event/opportunity system, but these are positive first metrics for a contentious feature.

Citadel Math

Though the general statistics look good, Citadels are weird.  We can't yet track them in our stats (though recent updates have cleared up the API blindspot) and a wild west of bug-or-feature has made it hard to get a solid hand around Citadels in the long term.

Rhivre has been the authority when it comes to citadels.  Specifically, she brought up that the June Faucet/Sink graph looked particularly light.  Quant has responded that Citadel data should be in the report.


The sinks retracted a lot more than many originally expected.  Also, the big dip in Active ISK Delta (money leaving the system because of account lapse) is mildly troubling.  Though April/May proved to be record setting in terms of ISK sinks, June returns us back to the ~45T level.  Half because blueprint outlays (citadels) have tapered off, and half because a chunk of broker fees are now going to players in Citadels rather than being properly destroyed.  

Citadels remain a big topic in many market channels.  Specific recent highlights are things like a 0% fee Citadel dropping near Jita, and Hek not being in the citadel exclusion list.  Also, though there are some big bugs out there (Citadel timers are immune to TiDi), the strategic value of these structures is coming into focus.  We stand by the current advice that summer is the time to lock in positions.  There are a lot of set pieces that should make the fall very interesting when activity picks up.

The Rest Of The Summer

Coming into late July/August, things should be very quiet.  It's a heavy vacation season, and CCP has historically been very quiet in August.  General activity is staying well stoked given the traditional retraction, and it will be up to CCP to keep that fire stoked with activities.  Again, it's my strong advice that this is the time to grind up that cash, stash away those cheap PLEX, and generally recuperate ahead of the fall.  Many signals are pointing to an interesting season coming up and Alliance Tournament and EVE Vegas should get the hype trains moving.

Meanwhile, at ProsperHQ, we're still chugging away on our tool revamp.  Work starts in earnest this week on our data backend, and goals to get you all access to our data continues roughly on schedule.  Once a few more pieces come together, expect a "state of Prosper" blog in the next few weeks! 

Thursday, June 9, 2016

Reading the Tea Leaves - May Econ Report

Props to CCP Quant sticking to a pretty reliable reporting schedule; May's Monthly Economic Report has been released!  I know the report can be a little sparse for the general reader, so let's walk through it.  Also, if you're interested in the specific stats, go check out Quant's EVE Vegas talk:


What does Lockefox Look For In These Reports?


re-crunched version from original
I like to jump straight to ISK velocity first thing. It has quickly become my favorite stat as an effective short-hand for "heat" or "energy" in the economic system. Also, when paired against PLEX, it helps complete the picture of cash-ISK supply/demand; proving out the demand side of the equation.

Personally, I've found the period since YC118.2 launched (skill trading) constantly surprising. With one feature, ISK velocities were doubled, and though it would be easy to think that it was just a flash, indicators have remained incredibly strong for several months. I continue to expect precipitous falls in each economic report, and I am surprised every month by just how much activity is out there.


To be an armchair-developer for a moment: ISK velocity stands as the primary indicator I would grade releases and development progress on. Where PVP activity is a decent waterline for some balance changes, World War Bee proves that can be a fickle line to balance against. PCU numbers are another popular open metric, but tend to be extremely noisy and seasonal, and less useful in the long run due to larger trends. ISK Velocity shows more directly cluster-wide activity and patch-performance.

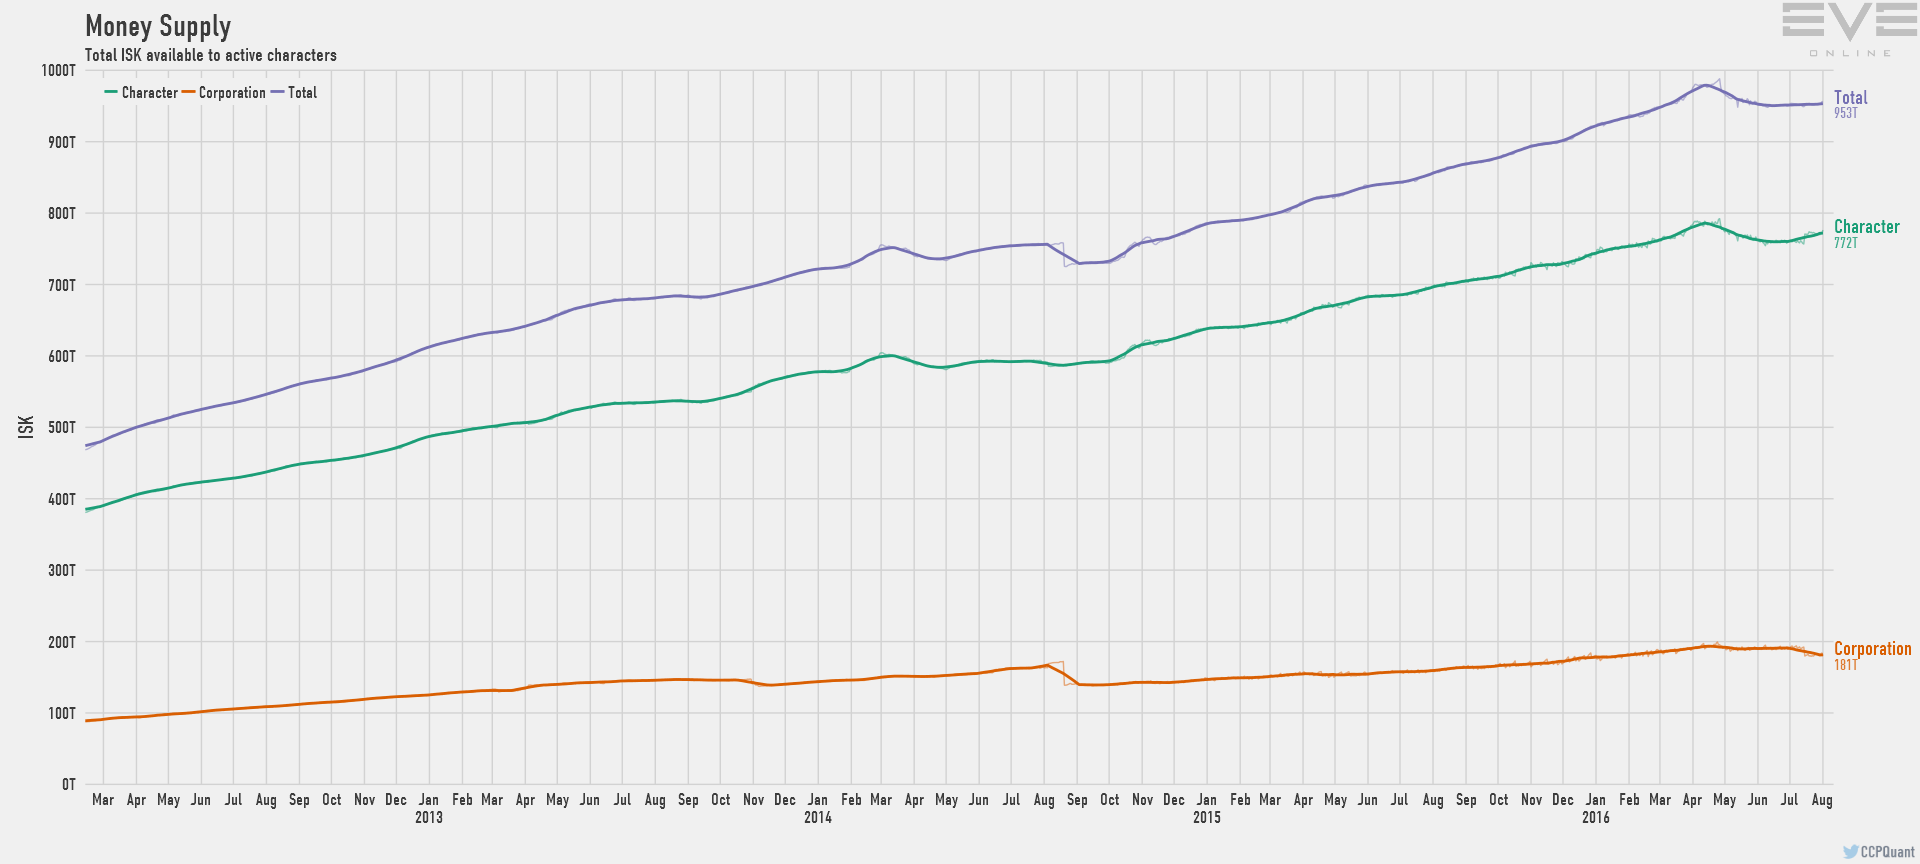
Furthermore, it's a useful metric to explain some of the unprecedented PLEX performance since the start of the year. Looking at total cash supply, it’s very strange to see a protracted period of cash-decline. These coffers will need to be replaced, and though prices may be weak right now, PLEX should rise as balance sheets move back into the black.


What's Special About May's Report


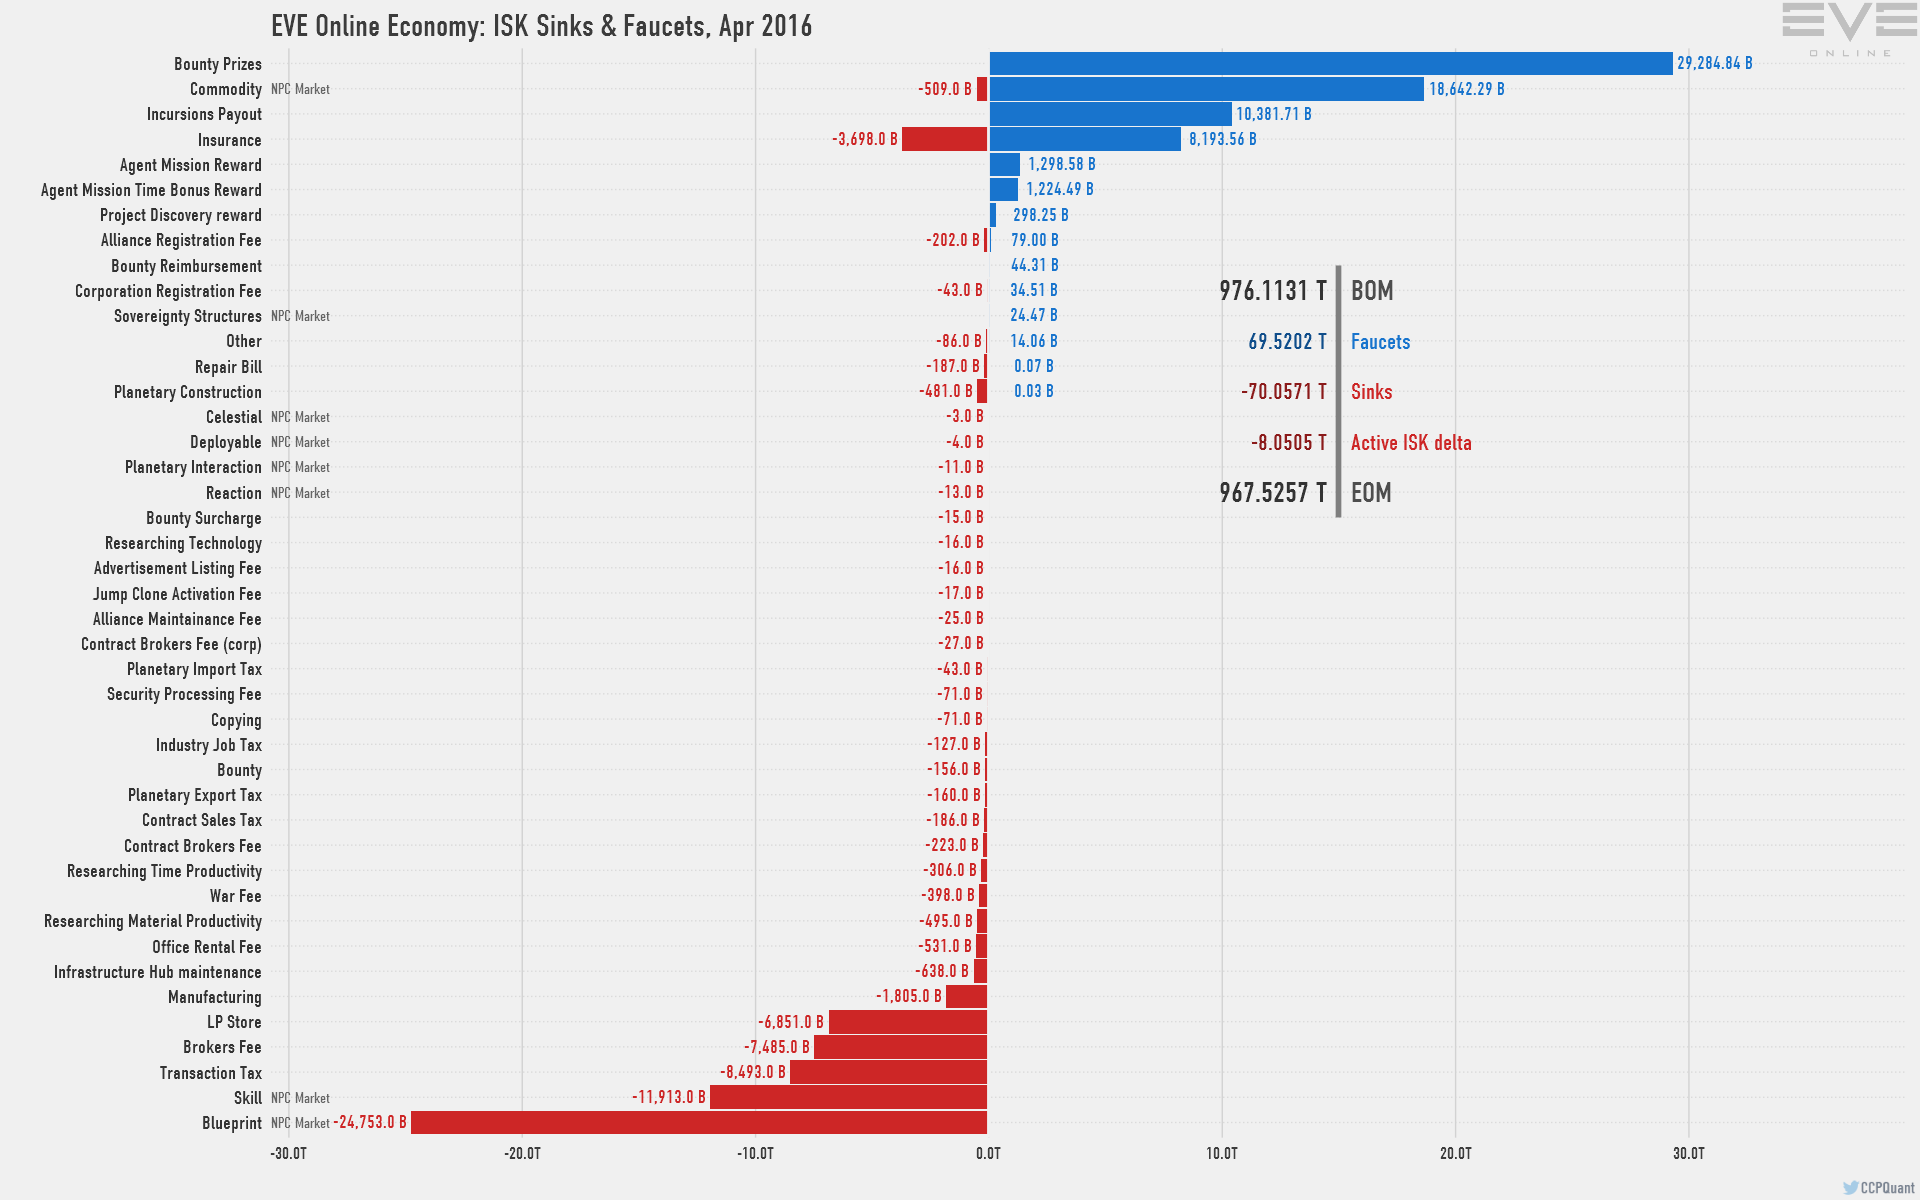
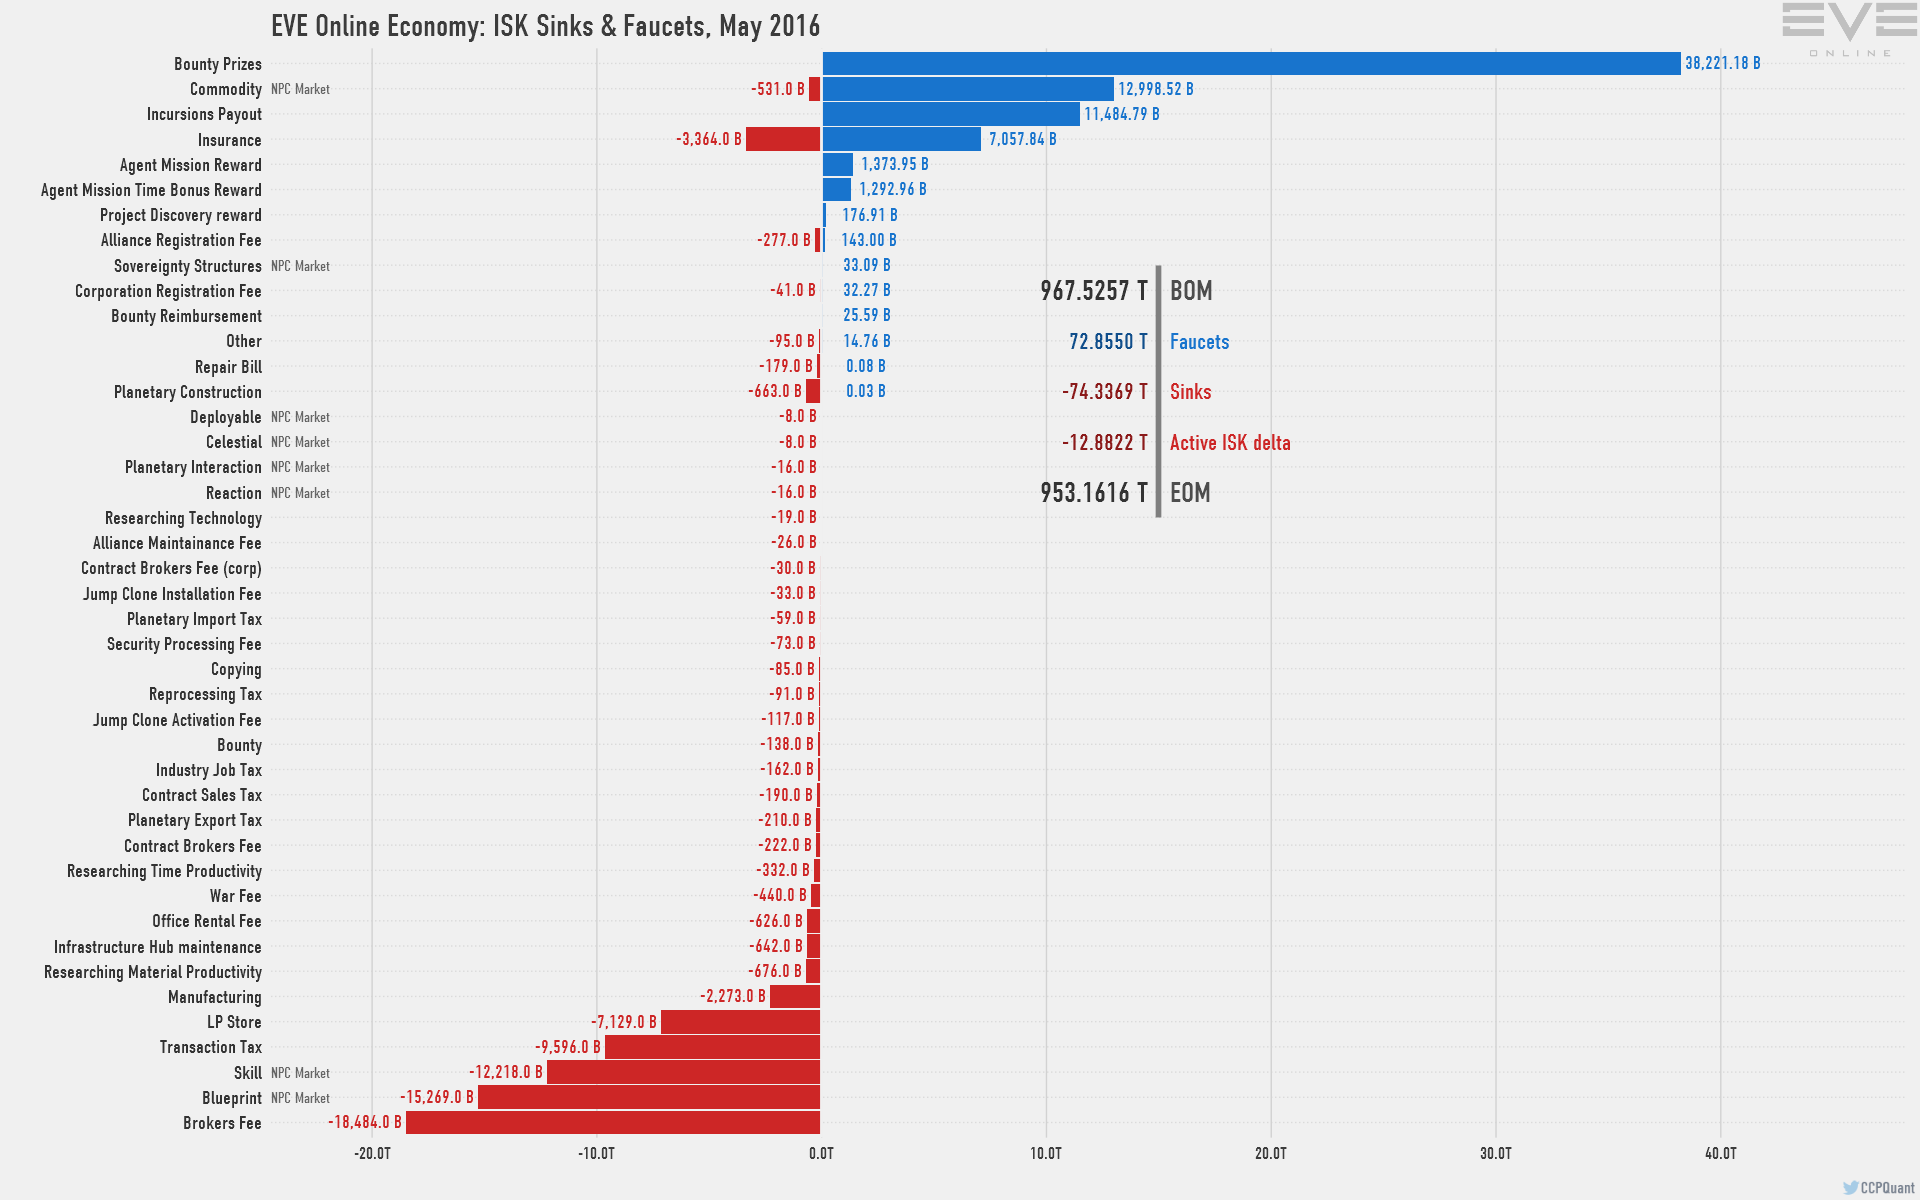
The second piece of the econ reports I jump to is the faucet/sink accounting. A lot of armchair-developers like to wield faucet/sink mechanics haphazardly in their F&I ravings, and disregard the complexity of monetary policy. And though I have my own opinions about some faucets, CCP Quant's reports show balances moving in good directions while using sneakier and less mechanically direct methods than I would have originally considered.

April and May's reports show a couple of interesting trends.


First, as Quant pointed out in April's report, it's the first time we've really seen a net-negative balance sheet here; and May continues that trend. And second, the the amount of cash in the Active ISK Delta is particularly high given the launch of the brave-new-world of Citadels. This is probably due to some amount of summer slump, and a healthy amount of fallout from WWB winding down. I'll be interested to see just where Active ISK Delta goes in the longer term.

It’s tempting to read the nearly 2 Trillion ISK shortfall as a bad omen, but if you zoom in on the production numbers, you'll see where all that ISK went: Citadels


It's hard to talk about how much impact Citadels will have in the long run yet. I think we need one more month of statistics before we can really see the entire citadel picture solidify. Pair that with the blind-spot the CREST/XML API's have for tracking citadels, and it is extremely difficult to do independent analysis of their rollout.

Other Trends


I find it interesting pairing the general kill statistics vs ISK velocity. We see a weak correlation during the YC118.3 spike around WWB, but ISK velocities remained strong until the end of May despite a retraction of PVP activity. Though I expect PVP numbers to stay weak over the summer, the general activity statistics should remain strong.

If I were to peer into my crystal ball for the summer, I would hope we're heading toward a period of stability. Skill Trading, WWB, and Citadels moved so much liquid ISK around, and destroyed a good amount of that cash and material, that I would think many need a period of reprieve to recover from the hangover. Also, the destruction rate for citadels is higher than I expected, so we should still see a somewhat higher clip for material consumption.

I originally pointed at PLEX and figured we would start slowly swinging the balance back, as people move to refill their coffers, but sales and general instability have dropped the price again from 900M to 850M. I do expect a hot fall/winter after this summer, so it would be an excellent chance to recuperate and prepare for new changes and territory battles in the most valuable pieces of space.

Tuesday, February 16, 2016

Skill Point Trading - Follow Up

I posted two weeks ago a forecast on the brainmeat market, and I wanted to review those predictions and talk about where I see the market, as well as some hits and misses.

Extractor AUR Prices

Though I am somewhat upset about the specifics about the AUR/$/PLEX prices, we hit the targets on Extractors right on the head.  I would have preferred if injectors were closer to 5/PLEX rather than the 4/PLEX we hit, but especially with generous sales directly during February I think the extractor market is exactly where it should be considering.


I was a little fuzzy after the specific packages were announced whether we'd hit closer to the 800AUR or 900AUR levels, but it looks like an 800AUR equivalency with PLEX is a decent place to peg the price to.  Now, it's worth mentioning that the PLEX conversion rate and the $->AUR rate are not the same dollar-for-dollar.  Especially under the current sale, directly buying AUR results in a bonus 1000AUR vs PLEX.


I do find it frustrating as a customer that my $20 or $100 can yield such wildly different returns, and that those returns are not all strictly transmutable.  But this is a core design of the AUR system where it's hard to go both ways between ISK<->AUR instead having to go through middle items that may have wildly different returns.  I'd very much rather see a more direct path between ISK<->AUR<->PLEX so that the $->ISK rates were simple for customers.  But I seriously doubt CCP and I will ever see eye-to-eye on this case.

Injector Prices


Injectors have me very worried.  In the entire lead up, I had expected that ISK/SP would be discounted vs the PLEX rate.  This would provide a negative-feedback-loop vs PLEX and would preserve the balance between Character Bazaar and Injectors.  Even CCP Quant's Bazaar Analysis pointed to this discount trend.


This positive valuation has me very concerned.  Simply put: this makes EVE free-to-play if you sell off your SP.  I think this leads to a lot of instability, since it will drive a positive-feedback-loop on PLEX demand without any sort of negative counterbalance to keep the system in balance.  Left unchecked, we could see a situation where MPCT + Extractors on all 3 slots of an account could actually net a positive return.  Whereas, if ISK/SP is discounted vs the PLEX-rate, it gives deep discounts to utility characters without making them free outright.

Now, over the course of writing this, the injector market has dipped a couple times under that parity line.  And I will be keeping a very close eye on the market over the coming days.  This heat might just be a factor of novelty, and a steady state may take a couple weeks to settle down.

Other Markets


Other markets are actually kind of hilarious.  I expected people to want to trade in Injectors/Extractors, but I didn't expect large markets to liquidate to change positions.  PLEX was particularly interesting because the volumes traded to jump on the AUR bandwagon drove actual traded volumes crazy minimal impact to the total orders on the market.


With net trade up so high, I expect there to be a lot of good trading to jump in on for the next week outside of the SP trade, with an opportunity to jump on the Injector/Extractor market coming by the end of the month.  

Though this hasn't stopped some people from going completely nutso:
Speaking as a pilot with a 200M+ main, and over 500M SP between all his characters, I don't think there's going to be many drives for "perfect" characters over the 200M mark.  There is glory in being first or second, but there's precious little utility in having a truly perfect character.  It will be interesting to hear CCP Quant's official report, but I expect that most consumers are in the first penalty bracket from 5-50M SP once we get to the 30d mark.  

Thursday, February 4, 2016

How I Data Science - Hunting For Trends

Long time friend Blake at k162space.com has been pumping out some really exciting work around NPC-kill rates.  He recently poked me about taking that raw data forward to something with more teeth, and after futzing with it for about an hour, came out with some interesting data.

His inquiry reminded me of a common question I receive: How do I get into data science?  So, this blog is going to be a bit more long/technical than the recent fare.  We're going to walk step-by-step through the investigation process and I'll try to illustrate what I see as we go along.  The readouts were generated using JMP, only because it's faster to use than R.  This entire process can be done in R, and I can revisit with more specific R samples if its requested.

Let's take a look:

Tuesday, January 5, 2016

EVE Economy - 2015 In Review

Getting quite a few requests to talk about 2015 as a whole this season.  Being news/short-term minded, I wasn't prepared to talk at length about the year in review, but I adjusted some scripts and pulled the data for you all.  This is meant to be a look at our forced core-basket products for Prosper.  A greatest-hits blog will take some more effort, but be sure to leave a comment if you want to see more!

And if you want to skip straight to the graphs, I've put together an imgur gallery

PLEX


I have been cutting my teeth on PLEX all year.  It's the first product people want to know about, and there are a lot of people shilling opinions of wildly varying quality.  I said at the start of the year that 1B PLEX should be expected in 2015, but I missed the timeframe.  Originally, I was expecting 1B PLEX by fanfest, but a mix of ISboxer fallout and extended out-of-game sales on PLEX kept the lid on the market.  But the summer showed sustained growth that suddenly exploded in September, rocketing us past the 1B price to a steady state now around 1.2B.  

I still believe the price of PLEX is overvalued, but the current dip down to 1.15B looks to be a local minimum, and it's a really great time right now to stock up for the year if you're looking to replenish your stocks.  Also, I expect the prices of PLEX to have less positive-volatility with the release of skill packets or brainmeat, but CCP has been quiet on details since fanfest.

Wednesday, October 21, 2015

Signal to Noise

I have been working with the crew at CapStable for the last couple of weeks on a news project. With all the hype CCP has been generating about capital changes announcing at EVE Vegas, there have been rumors of those changes being leaked by someone on the CSM.

I have no hard evidence pinning any CSM member to a leak, or specifics about what was even leaked. What I do have are some suspicious flags turned up for EP040 of the EVE Prosper Market Show:


I don't want to dive into specific politics as I am not entrenched enough to really build a compelling case confirming or exonerating any specific rumor.  But, I do want to cover the methods of what flagged, expand on why, and see if there is any actual merit to the rumors or if it's just a case of confirmation bias.

What Did The Tools See:

If you're interested in exactly HOW Prosper flagging works, please check the Price Flagging blog.  TL;DR: looking for deviation from a moving average.


After doing this Prosper project for a year, I tend to categorize flags 3 ways: 
  • General market noise
  • News related flags
  • Unique flags
That last category is specifically for "weird" behavior.  Things like item groups that never flag, core basket items like minerals or PLEX, and high-meta items that look like loot-table changes.  In EP040's flagging these items piqued my interest (note: SIG is a factor of strength/direction of a given flag)
Just looking at the charts, either side could be vindicated. On the one hand, the basket is pretty damning looking at so much capital equipment tripping flags. Specifically Siege Modules and Drone Control Units triggered my interest because they have never flagged up to now. On the other hand, this could just be scrupulous speculation; capital changes are in the pipline, a positive outlook could be rewarded ahead of time.

Zooming In

This is exactly why we collect EVE Central data as well as CREST market histories. Though I do not use the other hubs in the show this was a great opportunity to use some additional data. Where before I would just push the flags as the main evidence, we have the EVE Central intra-day data to back up or refute any claim.

The plots are included after the break, as well as some links to more expanded versions. As for conclusions, I think the project is a wash. I find the Siege/DCU flags particularly suspicious, and though it looks very small, the Tritanium bump is troubling. Otherwise, the other flags just look like normal market noise. I have heard some more substantial murmurs that the rumors might have merit, but I was unable to find the smoking gun in my data.

Monday, September 21, 2015

Q4-2015 PLEX Prediction

Preface

With the price of PLEX reaching new records, the conversation always centers around what is the appropriate price of PLEX.  As Dr. Ejyo was fond of saying "The right price of PLEX is the price players are willing to pay".  

Though there will be an outcry from players about the play-to-pay equation becoming unbalanced, the price of PLEX will keep rising to meet the demand for the item.  But as the price rises, I expect to see a whole host of related behaviors feed back upon themselves to drive the frenzy and will make the peaks and troughs hard to nail down.
  1. Deflation/Liquidity squeeze: players will avoid spending their ISK on consumption, instead either keeping it in reserve or buying more PLEX than they usually would.
  2. Net worth chasing: players concerned with total value will move more liquid ISK into PLEX to preserve purchasing value against PLEX
  3. Investment chasing: as the rise becomes more pronounced, players will use PLEX as an investment rather than as a consumable.
In short, I think the current peak is unsustainable right now.  However, a 1.3B-1.5B PLEX by the end of the year is absolutely possible.  To dream of the good ol' days of sub-800M PLEX is as foolish as predicting 2B+ PLEX.  I think to expect a band from 1.1B-1.3B for the quarter is a reasonable expectation.

A Prediction In Parts

I expect Q4 to be split into two halves.  Now to Thanksgiving (US), and then the rest of the remaining year.  This is similar to last year's predictions where I expect positive trends through November, as it is traditionally a busy time in gaming.  Then when December hits, I expect negative trends as play tapers off paired with expected sales.  The trouble is picking a starting point for the predictions, but I based off the 60-day moving average to avoid starting in unrealistic territory.


Raw Predictions
Code Source

To briefly sum up, I believe we will continue in a positive realm to a steady price of 1.3B (+10%), then see a back off to 1.2B (-10%) to end the year.  Again, it's really hard to predict prices with the recent wild swings, but I based the behavior off the similar period last year.

Also, I'd like to note that 2 of the last 4 weeks triggered price flags in the Prosper toolset, which is strong indication of instability.  The only times I've seen PLEX trigger these models were before big action on CCP's part (ISboxer bans).  I can't know what CCP is doing behind the scenes, but I'd bet on something popping the bubble sooner rather than later.

Conclusions

We are in unstable territory to be generating predictions in, but the net direction of PLEX over history is up.  Also, say what you will about the health of the game vs PLEX, the honest truth is as long as people are willing to buy and [over]valuate PLEX, the price will climb.  We were on a positive trajectory before the ISboxer changes last year, and CCP's rule change eset the general demand to consume PLEX.  Though we can't know actual PLEX consumption rates, a traditionally busy Q4 paired with AUR consumption may drive us closer to the high-line than the low one.

Also, for as much work as this was to generate, I'm going to keep the making of to another blog.  Stay tuned here and on the EVE-Prosper Market Show for more information as it develops!

YouTube
Twitch - Live Fridays 0200
Support us on Patreon

Tuesday, July 7, 2015

Aspiring Hari Seldon - Developing Price Predictions (Part 1)

With the Prosper Market Show on semi-hiatus for the summer, I'm trying to put the time toward developing some new utilities for analysis.  Though I have plenty on the to-do list to work through, I wanted to toy around with some future-looking tools to help illustrate some of the intuition I see moving forward.

Specifically, after looking at some examples, I wanted to try out Monte Carlo analysis.  The idea being if you take a decent prediction methodology, then generate thousands of predictions, you can average out the noise to get at the true signal.

Stage 1: Generating Predictions

Knowing nothing at the start, I picked up Geometric Brownian Motion as the predictor function.  It's relatively popular and well supported, and is handily ready in an R Library.  I won't even begin to claim I am an expert as to what's going on under the hood, but the general concept is pretty straight forward:

Next Price = Current Price + (expected variance)*(normal-random number)

The variance can be tuned as a percentage to express how far any individual roll will move, and how widely the random-number-generator will vary.  To find the numbers, I had to do a bit of hackery, but if you want to see the full methodology, check out the raw code here.  Also, it's worth noting that GBM does take into account interest, but I've zeroed out those numbers for the time being.

Using CREST data as a basis, we can pick a point in time and generate some predictions looking forward.  But due to the random-variance methodology, some predictions are good, and others are not:


These are 3 independent predictions using a low/med/hi variance seed into the GBM function.  The "high" line trending down and "low" trending up are a matter of which rolls are winning.  If you look more closely, the bounds on low are much tighter where the high is much more wild.  Given another set of rolls, the best predictions will change.

The weakness we should be aware of is rolling errors.  Because the GBM function is a recursive and random guessing function, if predictions start to stray off into the bushes, it's hard to expect they will come back.  This model uses a single price to start walking, and the further it walks, the wider the end results will land.

Step 2: Generate a lot of predictions

Happy with the general behavior of the model, the next step is to be able to generate a lot of guesses.  Randomness should wash out given enough trials.

Though I was able to wash out the randomness, the end result is not nearly as useful as I was expecting:


Summarizing the predictions by-day gives us a much different picture.  The randomness is gone, but we're left with a less useful "cone of possibility".  Though the end result we're looking for is definitely a "zone of possibility", this picture is not a useful automation of that concept.  Specifically that the median prediction is roughly "the price will stay the same", this is not a useful prediction for most items.

What is going on?  Well, here we can actually see the GBM function for what it is and why it is breaking down for our predictions:
  1. Assumes +/- variation is equally probable.  Here it looks like the distributions are strictly normal, which means they are centered around 0 +/- variance over time.
  2. Takes no history into account by default.  Function takes a single price and a single variance variable.  Understands nothing about max/min variance
This is particularly absurd for PLEX where variance/volatility is largely positive.


Just looking at the variations for the last year, almost 60% of the movements were positive.  We could further enhance our predictor by looking at a more recent window.

Step 3: Back to the Drawing Board

After chewing on this problem for a few days, I do have some things to follow up.  Though there are some other models to try in the sde package, I do think we have some options on how to get more useful predictions out.

Convolve Predictions?

This is one I've gone back and forth about.  I'd like to be able to "sum" together the predictions to get the general "tone" of what is going on.  Except that it's been 5 years since I took a digital signals class, and my attempts so far have just been guesses.  Though R is ready out-of-the-box to do FFT/convolutions, I need to better understand what I'm asking the program to do.  Currently, all attempts run off to infinity.

Exponential Predictions Using Volatility

After seeing the outcomes of the GBM experiments, I'm instead seeing a different trend pop out.  If I just pick a low/med/high variance out of the distribution, I could better generate a window in the short term.  Simply project forward the same %variance forward.


Another option is to get witty with the actual high/low bounds to narrow the prediction off our existing price-flagging system.  I just picked 25/75th percentiles, but we could narrow those bands with a smarter lookback to characterize how "wild" the last period has been.

Get Smart: Filter/Augment GBM Outputs

The last option is to roll some of my own ideas into the random-guessing function.  Using the historical variance as a seed for guessing-function, and/or dropping predictions that don't at least make a good prediction for the last 10 days before moving forward to the next 10.  I'm not yet convinced either is better than the far simpler exponential predictor above, because I would expect the exponential pattern to still wash out in the end, especially if we stick with a Monte Carlo style approach.

The hope would be to start a random function on a linear path (perhaps take 2wks into account) then have exponential variance as the high/low bounds to build a channel.

EDIT: using RSI as a prediction filter yielded some interesting results.  There is still some tweaking to do, especially for items that have had a recent spike into very unstable territory but initial forays seem promising


Conclusions

I'm really disappointed with the outcomes from this project; a lot of articles online made this sound like a magic-pill.  Instead we see the underlying nature of the model once randomness is removed.  Though it's not a complete loss, I was hoping for something a little wittier than a linear fit, but CCP Quant has pointed out Forecast inside R for more tinkering.

The nice thing out of this exercise has been being able to quickly experiment in R.  Though there are still some pretty considerable hurdles between these experiments and actual inclusion in the show, I was able to work with some pretty powerful packages extremely quickly to really dig into the problem and iterate quickly.  I continue to be impressed with R as an exploration platform, but still have some hesitance on integrating it in more powerful ways.