Showing posts with label graphpron. Show all posts

Thursday, March 2, 2017

Aspiring Hari Seldon - Part 2

Been quite a while, but I have a follow up to this old post.

A Crash Course

Tinkering with prices is difficult, and most players may not understand why.  Though we all interact with the price of things, unspinning the mess of how and why becomes complicated fast.  

What's worse, the price of a thing doesn't follow traditional fitting tools, it's a collection of ups-and-downs day-to-day.  It's a solution to a complicated network of factors.  This is why I've had so much trouble designing forecasts; because starting point is critical, and the walking methods aren't strictly obvious.

After dancing around this problem for as long as I have, I've come up with a few best-practices for approaching Prosper's economic reporting:
  1. Make it normal or linear: hard math is hard, keep analysis as simple as possible
  2. Figure out connections: storytelling can quickly connect seemingly disparate points
  3. Assume players aren't dumb: everyone is trying to win
  4. Look for disproof: try to eliminate weaknesses and errors in tools

Prophet - A New Crack At Forecasting

My boss sent me a link to Prophet.  And, of course, I threw EVE data at it!
On the one hand, that PLEX prediction is pretty hilarious, while on the other, the injector forecast is very close to one I'd publish on the show.

So, what is going on here?  I still think we're running into the issue of putting linear-style modeling on a non-linear problem, but we're getting much closer to the gut-version I would like to illustrate on the show.  

What's more, we can use a previous lesson and use the forecaster to predict the day-to-day volatility as a second opinion.  Using a GBM-style method, we get this:
Getting a second opinion in this case is a good way to counteract the problem of runaway models; forecasts that get stuck in a runaway up or down swing.  Though it's not fool-proof, we're reaching a "good enough" level to actually start considering it in our tooling.

Let's Go!


As promising as these initial findings are, I still worry they aren't a good replacement for more robust methods.  I'm still investigating the following:
  1. Single-dimension: only using price data, not including volume for supply/demand accounting
  2. Limited test scope: only run on CREST history data, not extended history data yet
  3. Time series rigidity: designed for daily data
  4. No extended grading done: need to test predictions vs reality
But the future is promising.  There are some key features I'm loving in this library:
  • Built-in changepoint trending: predicting discontinuities is very powerful
  • Python/R library parity: easy development/testing
  • Built-in week/month/season accounting
  • EXTREMELY FAST
There's so much more to play with, and I'm excited to dive deeper.  I'm looking into including these forecasts sparingly into the Prosper show going forward, as a better way to illustrate my gut feelings.  And hopefully we can incorporate these forecasts in a more robust feature in the near future!
TypeNames redacted while debugging


Subscribe on Twitch and YouTube

Monday, September 12, 2016

Fantasy Reflects Reality - August Economic Report

Thanks CCP Quant for releasing the stats AFTER the latest Prosper episode.  Monthly Economic Report - August 2016

Though there isn't anything particularly bad in this month's numbers, it didn't really live up to my expectations outlined in last month's summary.

Tell Me What You See

It's very "second verse, same as the first" looking from July into August.  A lot of the bulk stats look very good.  Net trade and PVP rates are staying steady and moving as-expected ahead of the YC118.8 release with its rebalance to mining.

Looking back at our favorite pairing, PLEX and ISK velocity, things looks good.  We're finally back over the 1B mark, and trending positive. 


PLEX is going to be extremely interesting in the coming weeks thanks to Alpha Clones.  Though I believe most of the positive and negative trends wash eachother out, I think there are some big changes in store for other trends outside of PLEX.  Specifically if more people are logged in and interacting with the game, even with the handicapped-clones, those could put some measurable pressure on mineral consumption and ISK velocities.

Also, most of the discussions I've seen around Alpha Clones center around "free ISK" and though the effects won't be zero (esp for skill trading... free baseclones), I think the pain of exploiting Alphas will tamp down most of the worst worries.  Lastly, we wouldn't be getting the F2P program if Team Security weren't up to sniffing out illicit activity, so I am not overly worried about massive botting rings.

Troubling Headwinds

What has me worried in the short term isn't so much the levels.  Absolute readings from all indicators are looking good.  But looking at the month-to-month rates have me worried.  Looking at the wallet statistics, I'm happy with the total ISK, I'm happy with the sinks/faucets, but I'm not happy about the rate of wallet growth or ISK velocity.  


I expected after WWB+Citadel that players would be able to recoup their lost wealth and start making roads toward regaining normal.  And though the sink/faucet chart says activity is returning to normal, the wallet status graph says total ISK out there to work with is diminished.  The trend isn't reason to raise alarm, but I will be watching these stats going into the winter.

Drawing Conclusions

I'm a big fan of Marketplace (and if I didn't have to work for a living, I'd produce those kinds of stories for EVE).  And if you follow their Friday Roundup, a recent theme with the IRL economic numbers are "it's good... but...".  I have a similar feeling about this month's report; I expected trends to start pointing upward into the fall, but we're just seeing flatness.  We also aren't seeing any fallout +/- from No Man's Sky, which is just a little weird given the bad press post-launch, but high engagement in a scifi property tangentially linked to EVE; I was anticipating some conversion to come back.  

The devs at CCP seem to be happy with the trends, but I remain slightly worried.  Things will most likely be totally fine, but there are some troubling headwinds in the latest numbers to just be wary of.  I fully expect to have more interesting news to report in the September and October numbers.


Monday, August 8, 2016

The Slow Summer - July Economic Report

It's been a busy summer, despite the hiatus.  The latest Economic Report numbers were particularly weak, and I was considering skipping the month.  But MarketsForISK has been publishing some serious articles and Delonewolf over at EVE Talk posted a review.


Though my fellow pundits took some serious dives into the data, I'd like to counterpoint with a more brisk review.  Be sure to check them out if you want more depth, but let's take a more general look at the stats.

Tell Me What You See

Ohboy, though last month's review was largely positive, thanks to "better than expected" activity metrics from the Serpentis event, July crashed down hard.  The month-to-month sinks and faucets chart was particularly troubling.


Though specific ISK sink/faucet numbers are in-line with the expected baseline, the Active ISK Delta (money leaving through inactive accounts) is worrying.  June's retraction was expected (WWB + Citadel) but July keeping up the trend is what concerns me.  Pair this with my favorite stat, ISK Velocity, and we're seeing a much harder retraction than I originally expected.


With the latest Blog Banter stirring the EVE Is Dying pot, these numbers could validate those looking to catastrophize.  I would not be so hasty to eulogize though.

Finding The Light

I don't think the numbers are all bad.  Looking at the net-trade and PVP stats, things are still pretty positive.  Are they breaking any records?  No.  But the activity is high enough to to be "normal" without having to panic.

NOTE: August dip due to database issue

Most market watchers have focused on the month-to-month net trade statistics (down 10-15% each month), but I've avoided them because I think they're a bit of a red herring.  For one, Feb-May numbers are much higher-than-average due to a series of effects all running together; so cooling should be expected.  Secondly, I think just talking about total-trade isn't as useful as splitting it up.  My analysis chops up the RMT markets (which make up a significant portion of the pie) and let us focus on the pieces.  This way we can see how each is moving to color the whole picture.

Material trade continues to be a hot market.  Those that are active in the game are still getting their content.  Also, as I've been saying since the last o7 show, it's an excellent time to be generating cash.  PLEX prices have only just recovered to the 1B mark (thanks to the AT auction).  The slump in the ship trade has me worried, but looking at the PVP statistics, it's hard to figure out what exactly is going on with PVP stats staying even while ships traded falls.


Lastly, we're still not quite seeing the cash-recovery I was expecting though, so there is still a lot of work left to be done to get back to truly normal levels.

Drawing Conclusions

It's easy to catastrophize in the summer.  Numbers tend to slump most at the end of July, campaigns slow, and CCP's news crawls through July/August due to vacation time.  I still believe there's enough on the plate this fall to be excited about, that as long as people don't get too bitter, there will be content to come back to once vacations end.

Looking externally, No Man's Sky is probably going to make the August numbers particularly bad.  Though, I do expect it to have a positive effect in the longer term, reigniting the hard-scifi spark that only a few games can, and perhaps bringing some contingent back for nostalgia.

If I may dip into Blog Banter territory and editorialize: it's a terrible time for picking out trends.  With the seasonal ebb and flow is at it's lowest point, drawing a line between June/July numbers would be Fox News grade cherry picking (o/ Sion).  Though I personally share a lot of Sugar Kyle's feelings of IRL vs EVE, and have been drifting more and more away from active play into a devfleet/metagame kind of role; like Jonny Pew, I just cannot drop the game entirely.  Is EVE going into a new chapter?  Absolutely.  Dying?  MMO's are dying, but I don't think EVE is doomed yet.

Wednesday, July 13, 2016

Beating The Heat - June Econ Report

CCP Quant continues to deliver the economic data.  June data released last week, and though summer is traditionally quiet, let's see if the data bears that out.  We did release our own market summary for the o7 show, but Quant's numbers released a good week after that show


ISK Velocity

As I said in last month's review, ISK velocity is the first stat I jump to.  I have this hope that ISK velocity will be useful in building better PLEX forecasts, and it's a good market activity metric to pair against PVP numbers.  Now with the benefit of hindsight, it's a little easier to draw the correlation between ISK velocity and PLEX direction.  With things cooling to a new normal level, I'm looking forward to tempering expectations a little better going forward.


When it comes to PLEX's record slide over the spring, it's useful to picture ISK velocity and PLEX prices together.  February had skill trading release, March/April had World War Bee, May had Citadels.  In this historic period of cash demand, PLEX (like gold) acts as an easy way to get at that liquidity.  With big door-busting features calmed down for the summer, I'm happy to see ISK velocity staying strong (~0.7) vs pre-skill-trading levels.

Small Note for the stats nerds: Quant's report uses a bi-directional 30d moving average to calculate ISK velocity.  I would rather use one that only looks backwards.  Will probably tweak the stat slightly going forward, which will take us out of alignment with Quant's official charts.


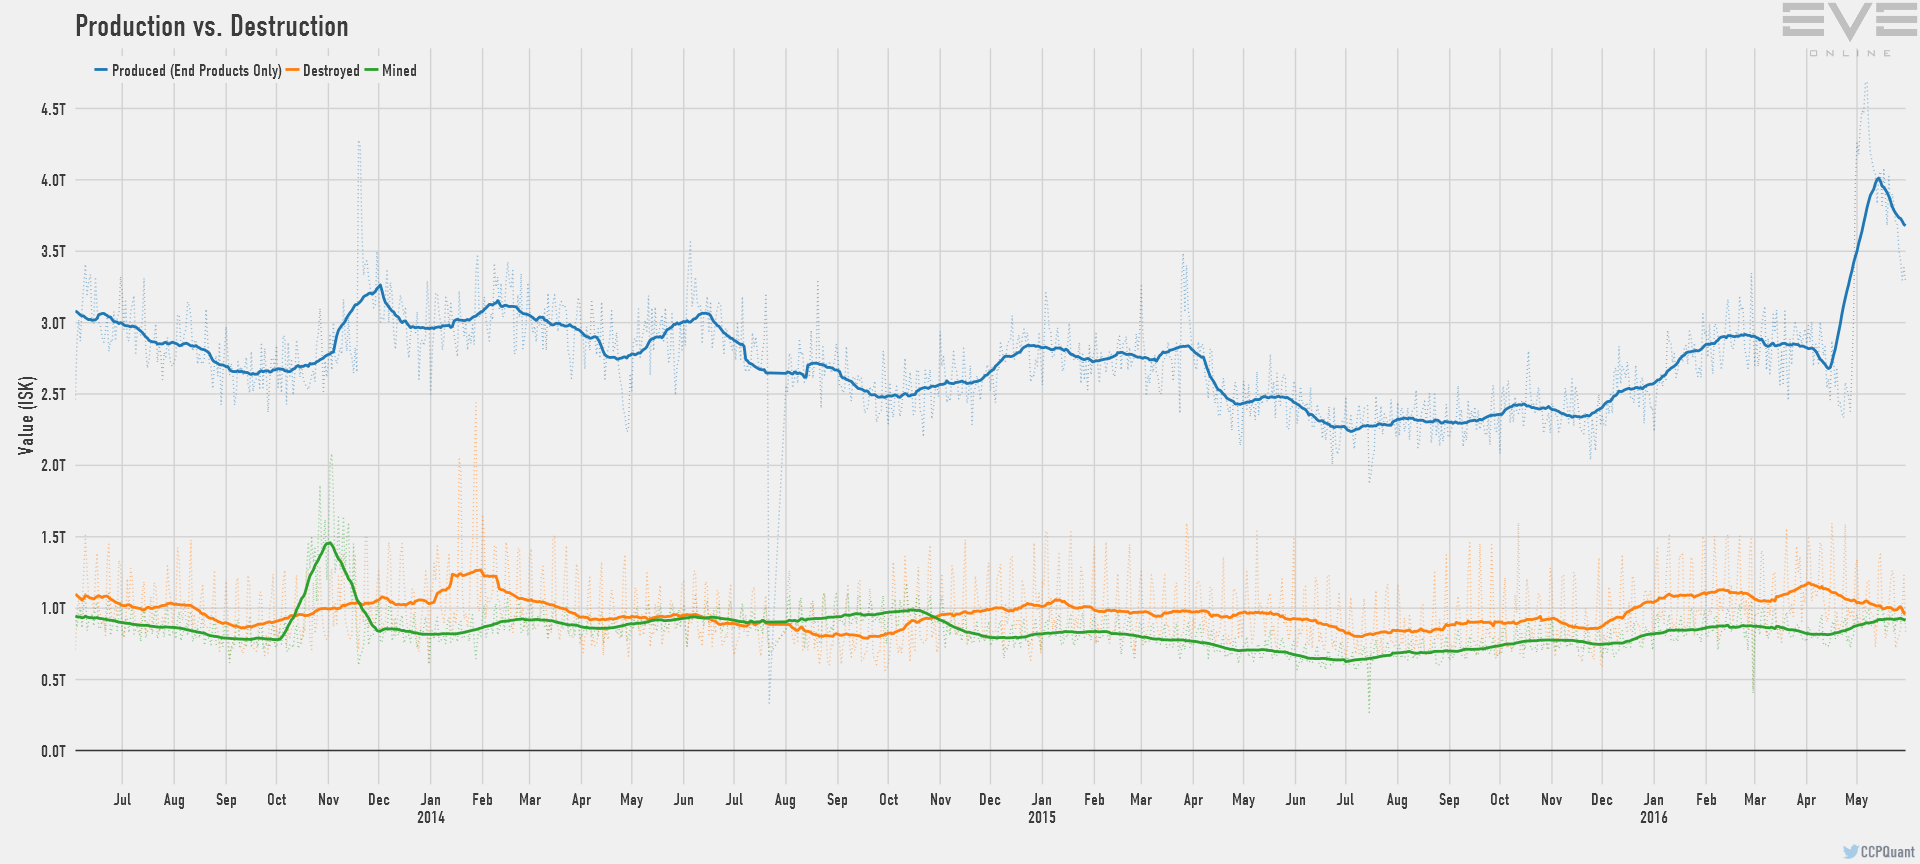
When it comes to activity statistics, I'm actually surprised how well June did in aggregate.  Though we're seeing a general cooling, we're actually above the points I originally spitballed.  Specifically, the slight uptick in value destroyed is interesting.  I'm not ready to pin this entirely on the new event/opportunity system, but these are positive first metrics for a contentious feature.

Citadel Math

Though the general statistics look good, Citadels are weird.  We can't yet track them in our stats (though recent updates have cleared up the API blindspot) and a wild west of bug-or-feature has made it hard to get a solid hand around Citadels in the long term.

Rhivre has been the authority when it comes to citadels.  Specifically, she brought up that the June Faucet/Sink graph looked particularly light.  Quant has responded that Citadel data should be in the report.


The sinks retracted a lot more than many originally expected.  Also, the big dip in Active ISK Delta (money leaving the system because of account lapse) is mildly troubling.  Though April/May proved to be record setting in terms of ISK sinks, June returns us back to the ~45T level.  Half because blueprint outlays (citadels) have tapered off, and half because a chunk of broker fees are now going to players in Citadels rather than being properly destroyed.  

Citadels remain a big topic in many market channels.  Specific recent highlights are things like a 0% fee Citadel dropping near Jita, and Hek not being in the citadel exclusion list.  Also, though there are some big bugs out there (Citadel timers are immune to TiDi), the strategic value of these structures is coming into focus.  We stand by the current advice that summer is the time to lock in positions.  There are a lot of set pieces that should make the fall very interesting when activity picks up.

The Rest Of The Summer

Coming into late July/August, things should be very quiet.  It's a heavy vacation season, and CCP has historically been very quiet in August.  General activity is staying well stoked given the traditional retraction, and it will be up to CCP to keep that fire stoked with activities.  Again, it's my strong advice that this is the time to grind up that cash, stash away those cheap PLEX, and generally recuperate ahead of the fall.  Many signals are pointing to an interesting season coming up and Alliance Tournament and EVE Vegas should get the hype trains moving.

Meanwhile, at ProsperHQ, we're still chugging away on our tool revamp.  Work starts in earnest this week on our data backend, and goals to get you all access to our data continues roughly on schedule.  Once a few more pieces come together, expect a "state of Prosper" blog in the next few weeks! 

Thursday, June 9, 2016

Reading the Tea Leaves - May Econ Report

Props to CCP Quant sticking to a pretty reliable reporting schedule; May's Monthly Economic Report has been released!  I know the report can be a little sparse for the general reader, so let's walk through it.  Also, if you're interested in the specific stats, go check out Quant's EVE Vegas talk:


What does Lockefox Look For In These Reports?


re-crunched version from original
I like to jump straight to ISK velocity first thing. It has quickly become my favorite stat as an effective short-hand for "heat" or "energy" in the economic system. Also, when paired against PLEX, it helps complete the picture of cash-ISK supply/demand; proving out the demand side of the equation.

Personally, I've found the period since YC118.2 launched (skill trading) constantly surprising. With one feature, ISK velocities were doubled, and though it would be easy to think that it was just a flash, indicators have remained incredibly strong for several months. I continue to expect precipitous falls in each economic report, and I am surprised every month by just how much activity is out there.


To be an armchair-developer for a moment: ISK velocity stands as the primary indicator I would grade releases and development progress on. Where PVP activity is a decent waterline for some balance changes, World War Bee proves that can be a fickle line to balance against. PCU numbers are another popular open metric, but tend to be extremely noisy and seasonal, and less useful in the long run due to larger trends. ISK Velocity shows more directly cluster-wide activity and patch-performance.

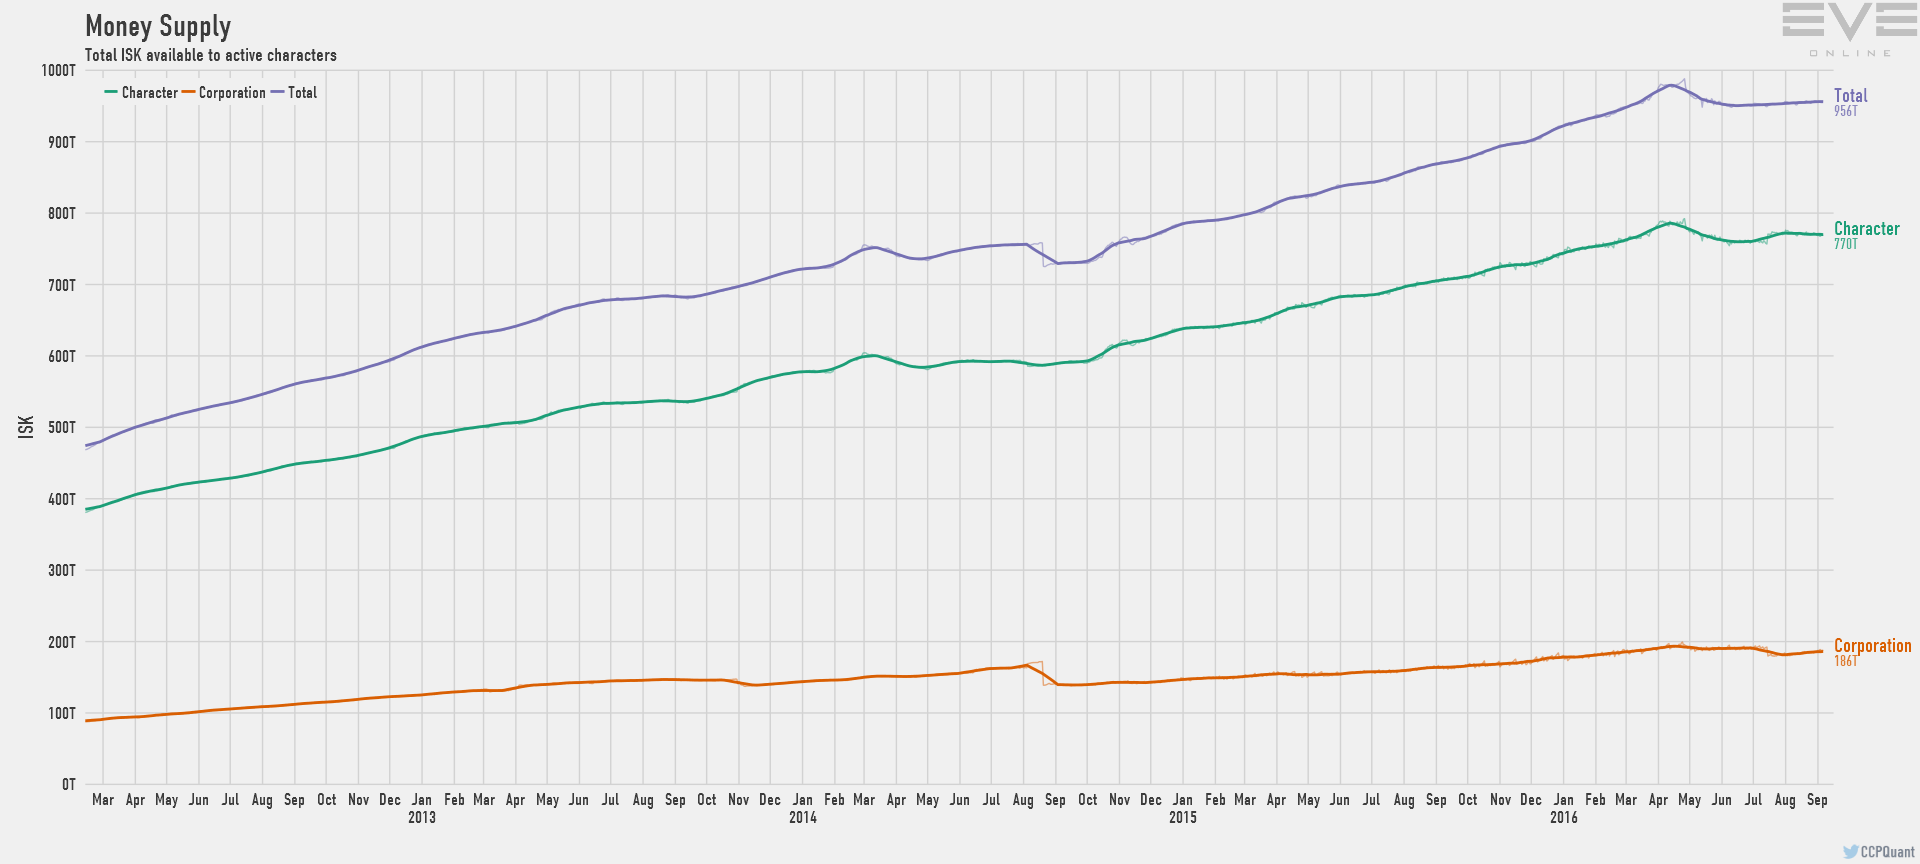
Furthermore, it's a useful metric to explain some of the unprecedented PLEX performance since the start of the year. Looking at total cash supply, it’s very strange to see a protracted period of cash-decline. These coffers will need to be replaced, and though prices may be weak right now, PLEX should rise as balance sheets move back into the black.


What's Special About May's Report


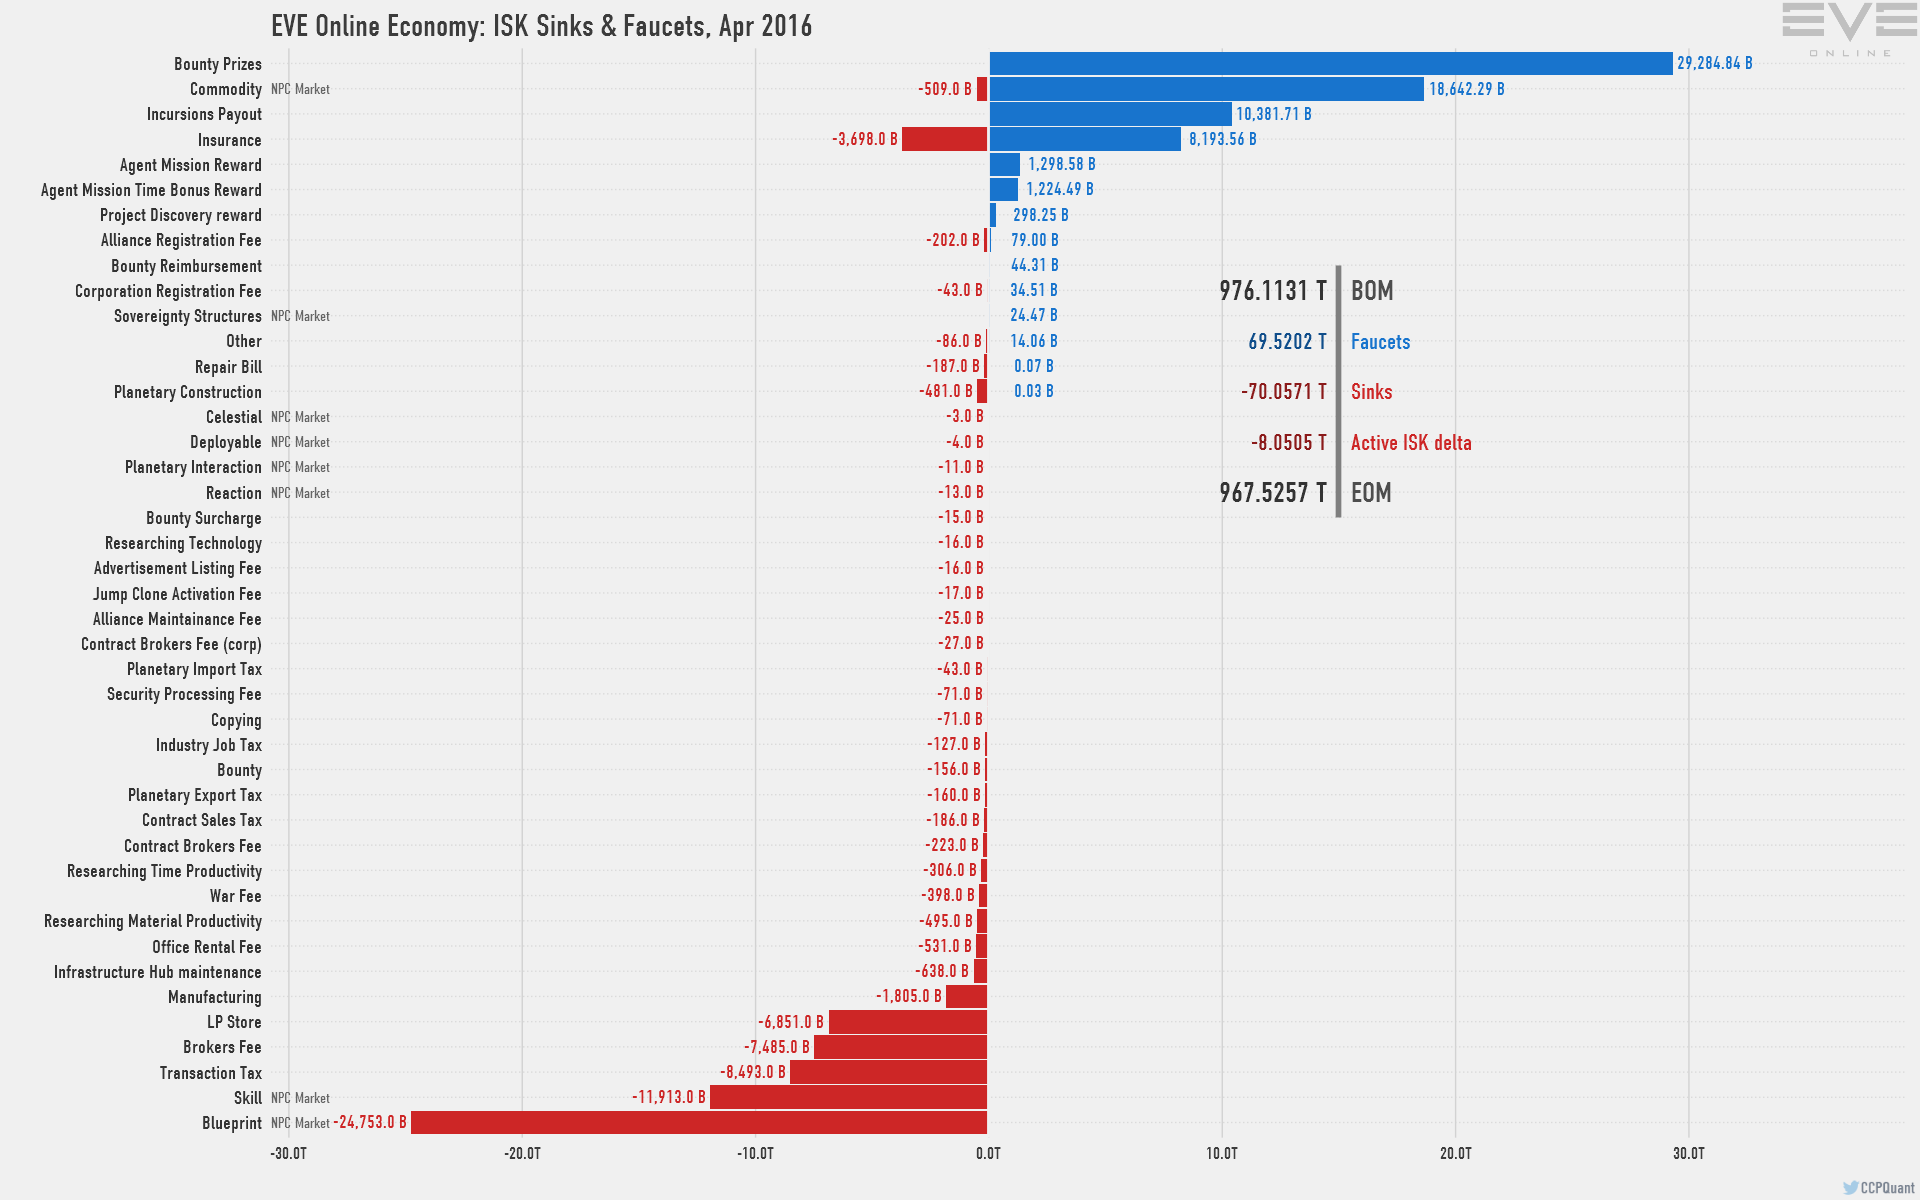
The second piece of the econ reports I jump to is the faucet/sink accounting. A lot of armchair-developers like to wield faucet/sink mechanics haphazardly in their F&I ravings, and disregard the complexity of monetary policy. And though I have my own opinions about some faucets, CCP Quant's reports show balances moving in good directions while using sneakier and less mechanically direct methods than I would have originally considered.

April and May's reports show a couple of interesting trends.


First, as Quant pointed out in April's report, it's the first time we've really seen a net-negative balance sheet here; and May continues that trend. And second, the the amount of cash in the Active ISK Delta is particularly high given the launch of the brave-new-world of Citadels. This is probably due to some amount of summer slump, and a healthy amount of fallout from WWB winding down. I'll be interested to see just where Active ISK Delta goes in the longer term.

It’s tempting to read the nearly 2 Trillion ISK shortfall as a bad omen, but if you zoom in on the production numbers, you'll see where all that ISK went: Citadels


It's hard to talk about how much impact Citadels will have in the long run yet. I think we need one more month of statistics before we can really see the entire citadel picture solidify. Pair that with the blind-spot the CREST/XML API's have for tracking citadels, and it is extremely difficult to do independent analysis of their rollout.

Other Trends


I find it interesting pairing the general kill statistics vs ISK velocity. We see a weak correlation during the YC118.3 spike around WWB, but ISK velocities remained strong until the end of May despite a retraction of PVP activity. Though I expect PVP numbers to stay weak over the summer, the general activity statistics should remain strong.

If I were to peer into my crystal ball for the summer, I would hope we're heading toward a period of stability. Skill Trading, WWB, and Citadels moved so much liquid ISK around, and destroyed a good amount of that cash and material, that I would think many need a period of reprieve to recover from the hangover. Also, the destruction rate for citadels is higher than I expected, so we should still see a somewhat higher clip for material consumption.

I originally pointed at PLEX and figured we would start slowly swinging the balance back, as people move to refill their coffers, but sales and general instability have dropped the price again from 900M to 850M. I do expect a hot fall/winter after this summer, so it would be an excellent chance to recuperate and prepare for new changes and territory battles in the most valuable pieces of space.

Wednesday, July 16, 2014

Can I Play With MA(C)Dness?

Blame this one entirely on @K162space.  He got me playing with Quantmod in R.  Also, shout out to CCP Quant for showing off the original bits, and CCP Foxfour for the CREST market history.

After all my EVE data experiments, I've had a very hard time finding predictive correlations between datasets.  Even trying to bring in destruction data showed no predictive properties, instead only showing correlation to corroborate market volumes.  Also, I've tried my best to get into Varakoh's analysis, but have never been able to internalize his methods enough to consider rolling it into my own analysis (also getting reliable candlesticks for EVE data is a pain)

Then Blake over at K162space.com sent me this tidbit:

Quantmod opened a whole new realm of tools I never knew about (full listing here).  The most interesting to me has been Moving Average Convergence Divergence (MACD).  I wouldn't be so bold as to say "use this to make money", but the results are extremely interesting when using IRL stock data.

INTC - YTD
For those that have never seen an MACD plot, the theory is relatively simple: Different line crosses are signals for buy/sell operations (specifics here and here).  Though the signals are imperfect, and will by no means catch every peak and valley, they can be an excellent sanity check for the longer trend.  For many IRL stocks these trends can have very strong correlation and are a popular tool among amateurs.  It is less useful for the minute-to-minute daytrading or arbitrage, but can be a powerful data source for the long-term investor.

Can this be useful for an EVE trader?  Well....

Let's look at a few plots:
PLEX - YTD - click to embiggen
Tritanium - YTD - click to embiggen
Phenolic Composites - YTD
I had to do a little fudging to get open/close bars to work correctly (though high=close=avg is roughly the same).  The trend information is interesting, but the crossover signals aren't lining up well.  Using the traditional 12,26,9 configuration, many of the crossover signals arrive 2-3 days late.  If you ended up using these charts as-is, I think you'd end up at best breaking even.  Though there are some secondary things you could do like buy and sell in the swings up and down, these charts aren't going to be immediately useful.

I then started playing with shorter windows, and pairing a fast and a slow chart might be a better way forward.  Unfortunately, I'm blindly fiddling knobs right now, but I'm actively hunting down documentation to better fine tune the charts.  I was thinking a 10-15d window might be more accurate, and a 25-30d window would serve well as a "slow" chart.

Also, I think the weakness has a bit to do with the quality of data here.  Where MACD is looking for close prices, we're feeding it daily averages.  This might be a good excuse to finally work on a better snapshot tool using eve-central data.  Though I had a lot of trouble processing down the raw archive, starting up a stupid-script that pulls periodically from the traditional API would be a quick solution that could start crunching in the background.  Once I can get my industry tools refactored, I expect to get back into the data mining game pretty seriously.

In the meantime, be sure to subscribe to my channel on Twitch, and follow on Twitter.  I will be doing some random streams over the next week as I get back into a reasonable routine again.

Friday, February 14, 2014

Interlude

It has been a whirlwind for me since the start of the year.  Was making some excellent progress toward tools, was cooking some ambitious EVE plans for my friends and myself, and then WHAM! IRL struck a critical blow to my free time.  Thankfully the blow is a net positive for me, not so much for you #graphpr0n fans.

What Is It You Do Again?

If you ever wondered why I have such a passion for big data, graphs, and manufacturing, you only have to look to my real life job: Wafer Test/Probe Engineer.  Simple TL;DR is we're the last stop for wafers in fabrication... we prove if the design and process meets spec to ship forward to package.  We filter out 95-99% of the bad die and provide direct data for process/design feedback.  In short, we're implementing all of the tests for the parts, and generate fuckloads upon fuckloads of data.

Personally, I've spent my time on Phase Change Memory, a NAND replacement.  With one project dying, I've been moved to a new bleeding-edge team.  Needless to say, it's been hot and heavy, and it's left me with almost no free time to do my EVE hobby work.  

In the end, I am an engineer first.  As much fun as messing with EVE data is, it's only an outlet to approach problems from work in a new light.  In all seriousness, I've been given carte blanche to do the data work I want for real, and may have the opportunity to pursue patents for my big-data work.  I'm not quitting EVE, but my time is going to be severely limited going forward.

"The Plan" v2.0

"The Plan" originally was to announce my CSM candidacy by now.  I was hoping to run side-by-side with @Fuzzysteve, and push API, industry, and general balance going forward into (a perceived) "Blue Doughnut" future.  I will need to dedicate another post to the entire CSM plan, and I'd still like to throw my hat in, but I don't feel like I can balance the CSM work load against the lucrative career opportunity that work has presented me.  

I've been trying to drive my sparse EVE time into helping Aideron Robotics conquer and hold Fliet.  This has left my industry operations in the lurch, to the chagrin of my new partner in crime.  There are some murmurs we're working through to perhaps push some new industry work, but in the meantime, I've been keeping my focus on Aideron's needs.  

So Many Inventions Half Invented

This massive shift in my IRL work has dropped in at exactly the wrong time.  I currently have the data/graphs/charts for two pretty big data pieces.  I pushed a lot of code between Christmas and the end of January... and I can't really share the results with you all because I don't have time to put the presentations together!

First, B-R5RB.  I was exquisitely well positioned for this fight, having just released a new tool for Aideron Robotics to take a different look at zKillboard data than I had done originally (more about it in March).  I was even approached by Crossing Zebras' Xander Phoena to do an infographic reminiscent of my Booster Consumption piece.  Despite my best efforts to deliver, my approaches did not solidify quickly and I am once again left with a dozen or so graphs and the data behind them... but no finished product.  If Xander is reading this, I really am exceptionally sorry I've been unable to deliver.  

Second, January's blog banter.  Thanks to Chribba, I have a dump of his eve-offline data up to mid January.  I was going to string this all together with market/destruction data to talk about the perceived lull in subscription/player numbers.  I had most of the data processed, but was lacking a good way to put it all together into a compelling story.  This is about 75% complete.  I will try to take some time soon to try and tie it all up... or at the least dump the #graphpr0n here for the general populace to enjoy.  There were some interesting conclusions, but I just ran out of time.  Enjoy a small scrap in the meantime.
2 Year Jita Market View - Click to embiggen
Lastly, it seems CCP Quant has taken the reins to push more EVE data out from CCP... which is awesome... but it's hard to compete as a 3rd party against the real thing.  It's been a great breath of fresh air to see CCP pushing their own data out again, since the loss of CCP Diagoras.

Wednesday, December 4, 2013

Better Piloting Through Chemistry

With all the recent PVP I've been doing in Aideron Robotics, chiefly against Russians in Old Man Gang, we've been faced with a higher class of solo/small-gang PVPer than any of us is used to.  Chiefly, the kind that ALWAYS has fleet boosts, and employs pirate implant sets.  These have made for some very tough nuts to crack, and have made defending Heydieles a real challenge.

Our answer has been to respond, as much as we can, in kind.  I've pushed two of my booster characters into the system with a full suite of fleet boosters.  I've been keeping a steady stream of fitted ships on contract where pilots can quickly grab them down and get back in the fight.  With the recent tide of allies and a generous US holiday, we've been able to turn the system in our favor.  Aideron Robotics has recently taken away OMG's POCOs (#1, #2), and really stomped down Caldari challenge to the system.

This isn't enough, and we've been scrambling for more to answer OMG.  There's no way we're going to push pilots into pirate sets and expect them to beat OMG at their own game, but we can leverage Combat Boosters!

The big problem with boosters though is convincing people to try them.  With the really steep penalties for use, and pain of transport/sale, most pilots completely discount them.  Though, if they are properly utilized, Boosters can be a real force multiplier when used in the right roles/ships.

Unfortunately, there are no really good definitive guides on drug use.  Ripard Teg's Fit of the Week segment usually highlights individual boosters when they make sense in a fit, and there are some written guides explaining how they work in wiki wall-o-text fashion, but there isn't a great go-to guide for them.  To push boosters on our greener members, and keep them active in our FC's minds for utilization, we need something better.

Making Infographics

Recently, Aideron Robotics has been pushing a "Making a Better Pilot" series.  Similar to a lot of TEST/CFC propaganda, cute infographics to try and curb bad behaviors or illustrate less-intuitive piloting ideas.  


Since my moon mining flow chart was so well received, especially with the siphon additions, I figured this was a good chance to fill a need.  Also, I'm eyeing Booster production, but the market throughput is kind of anemic, so I figured we could kill a lot of birds with one stone here:  Increase demand in general, improve Aideron performance in PVP, line the industry wallet, and contribute something to the overall meta (which I have been neglecting for the last month or so).

How It's Made

For the graphically retarded, Google Drawing in Google Docs is an absolute life saver.  Pair the image dumps(link) with some text and a little graph magic and GIMP.  The biggest problem I ran into is I wanted a radial bar graph... and had no easy way to make one.  Seriously... why is this so difficult?

What I Wanted

What I Made

The hope was to have a bit of a gauge to illustrate the various grades + skills combinations.  The hope was to illustrate that, with the appropriate skills, the chances of incurring a truly unacceptable penalty was very low.  Unfortunately, explaining probability to the masses is always a frustrating endeavor. Though I think I illustrated the reality pretty decently by pairing my chart with a character sheet view.  


Released infographics after the break!

Tuesday, October 15, 2013

Objective Complete: zKB Data Get

3.75M Kills parsed (2013 so far)
17.5M Entries
40hr estimated parsing time

Frigate 905,329
Cruiser 315,493
Battleship 77,617
Industrial 81,642
Capsule 929,041
Titan 25
Shuttle 41,814
Rookie ship 246,308
Assault Frigate 110,147
Heavy Assault Cruiser 30,583
Deep Space Transport 2,421
Combat Battlecruiser 170,480
Destroyer 332,165
Mining Barge 54,804
Dreadnought 2,218
Freighter 1,960
Command Ship 6,340
Interdictor 32,956
Exhumer 24,032
Carrier 4,873
Supercarrier 113
Covert Ops 39,401
Interceptor 52,546
Logistics 15,082
Force Recon Ship 24,132
Stealth Bomber 97,226
Capital Industrial Ship 247
Electronic Attack Ship 5,940
Heavy Interdiction Cruiser 3,961
Black Ops 1,129
Marauder 1,375
Jump Freighter 861
Combat Recon Ship 8,368
Industrial Command Ship 2,986
Strategic Cruiser 32,309
Prototype Exploration Ship 265
Attack Battlecruiser 82,652
Blockade Runner 11,583


Remaining To-Do

  1. Investigate count bug
    • Initial dump is 10x expected values on items?
  2. Finish "prettying" for release
  3. Update pricefetch to scrape all regions for full market picture
  4. Find a way to maintain/release .sql dump of data generated
  5. mySQL optimization and "bridge" scripts for smaller passes

Progress So Far

I have to thank a bunch of people for helping me get to this point where I have at least a passable crawler and data set to munch on.  I would like to get EVE-Central's dumps processed before moving onto the data science step, but we will see what happens.

Extra special thanks to:
I still have a lot of work to go between "working" and "good", but being able to stand upright and get my hands on this data is exceptionally awesome.

Finally, I can put together data like this:

Monday, October 14, 2013

Fool's Errand

I found today's Nobel prize in Economics interesting, especially since it's partially related to my project.

The prize winners, all vastly more qualified than me, state through their research that you can't know short term price fluctuations, but should be able to map longer term trends.  I might be in trouble, since my project is looking to do the opposite: chart with decreasing certainty a small number of weeks into the future.

The end product here is that I may not be able to do what I want with all this data.  But if I don't try, because it's "impossible", then I will never know.  I'd like to take this moment to talk through some of my dissenter's opinions.

Imperfect Data

This is the most common dissent I hear when people hear what I am trying to do: "But the out-of-game feeds are imperfect.  How could you possibly know EXACTLY [pick your metric]?"  I always end up countering with a classical engineering retort: "But I can get close enough"

If I may extend the metaphor, imagine you couldn't possibly see something with the naked eye (ISS flying overhead, for example).  If I could get a telescope to take a half-decent black-and-white picture of it, would that not be "close enough" for practical purposes to show you that it was there and what it kinda looked like?  I may not be able to provide the stunning HD pictures NASA can, but something beats nothing.

Exploring the frontier is all about using what you can to get what you need.  I may not be able to tell you EXACTLY how many noob frigates died this year, but I can tell you it's on the order of ~250K and probably under 300K.  Just because I can't know the EXACT number doesn't mean a good estimate has no value.  

Understanding Limitations

It's important to know the relative accuracy of the data you're collecting, and what your blind spots may be.  As far as kill data goes, these are the assumptions I am using:
  • PVP-kill quality
    • 95% quality.  API-only kills should provide extremely good coverage
    • HS kills will be less thourough.  But gaps should be very small
  • Other kill quality (NPC kills, CONCORD kills, self-destructs)
    • No way to view these kills.  zKB filters NPC-only kills before adding them to DB
    • These kills should account for a very low percentage of destruction data
The thinking goes: if something dies in PVP, it should get to zKB somehow.  It only takes one key to get the data.  Either from the victim or the killer, or their corps.  Now, it is possible to have kills unaccounted for, where the killer (killing blow) or victim or their corps don't have a key in zKB/eve-kill's records.  But losing sleep over the last ~10% that I can know is not worth derailing the 90% I'm already getting.

The things that worry me that I'm not seeing:
  • PVE deaths: BS/BC/T2 losses to rats
  • Suicide bombers: Attacker km's are ignored
  • Self destruct data: small segment of pod data not being tracked
  • NPC corp data that might be missed because killer doesn't have correct keys
The hope is these groups account for a very small fraction of the data out there.  

Prediction Quality

I expect to get a decent idea of the future price of something (trend up or down, by how much?) and network all those predictions together to feed to a machine that will automatically task out my manufacturing lines.  If the tuning is strong enough, getting a leg up on the shipping margin economy is a second avenue for activity.  

I catch flak when I describe this because people get mired in the fine details.  I might predict a 20% rise in price on a weapon, but only see a 10% rise.  That's still enough to pocket profit, and I'm better off having some numbers-based prediction than spending a ton of my time scouring the numbers and playing by "gut feeling".  Large repetitive math is EXACTLY what computers are for, and if I can tune the machine to have even a sliver of intuition, then I am ahead of my competition.

Today, I am using today's-cost and today's-profit to say that when I do get to market, I will be somewhere close to that prediction.  I also watch market order volume to make sure what I bring to market is a suitably small percentage of actual sales, so as not to be the downward force.  This is fine in products that swing slowly (most modules) but can be extremely troublesome in ships where bubbles are constantly forming/popping with fickle player tastes.  

My preliminary data doesn't show kills as a predictive metric.  But with kill data being extremely spiky (weekend warriors) I may not be looking at the groupings correctly yet.  So far, only pure-market numbers look like the trend setters.  This is probably because the kill data I am scraping isn't as publicly and easy to access as eve-central data.  But there has to be some amount of weight to put into "replacement" behavior rather than just purely buying and selling commodities without any other basis in reality.

I am wondering if I should get in touch with Chribba or Ripard Teg for their PCU numbers too.  Since player participation is pretty directly related to profitability.

Progress Update

In the end, you won't know unless you try.  Even if the data is purely scientific it's been extremely interesting to get a look at what is destroyed.  Raw dumps for those interested.

As interesting as that is, you get a very similar picture with sales data

If you overlay the two charts, the levels and spikes line up pretty similarly.
As for data parsed so far: total ~3.15M mails parsed
Frigate 902227
Cruiser 314795
Battleship 77331
Industrial 81221
Capsule 929040
Shuttle 3153
Rookie ship 245810
Assault Frigate 109897
Heavy Assault Cruiser 164
Deep Space Transport 30
Combat Battlecruiser 387
Destroyer 314605
Mining Barge 658
Command Ship 6280
Interdictor 32810
Exhumer 23516
Carrier 4873
Covert Ops 537
Interceptor 276
Logistics 14973
Force Recon Ship 177
Stealth Bomber 96750
Capital Industrial Ship 247
Electronic Attack Ship 32
Heavy Interdiction Cruiser 137
Black Ops 19
Marauder 27
Combat Recon Ship 53
Strategic Cruiser 377
Prototype Exploration Ship 236
Attack Battlecruiser 192
Blockade Runner 164

Tuesday, October 8, 2013

Kill Data Progress

Short and sweet on this one.  Just want to share some of the graphpr0n I've managed to get out of the work so far.  I've pushed the raw data dumps to gdoc if you want to play along.

Stacked Area

Stacked Area

Stacked Area

Progress

Frigate28000
Rookie ship241695
Logistics14736
Capital Industrial Ship245
Prototype Exploration Ship186

As of 2013-10-08 @ 17:45 MDT

Notes

The main guy I am bouncing ideas off of with this project is Valkrr.  Since he's doing a far more comprehensive version of my table, we keep swapping tips and tricks.  Some quick progress stuff
  • Features yet to add
    • Clean up progress printing
    • Better tune between-call sleeps
    • More information in the crash handler (group progress numbers, "globals")
    • Repeated kill protection
    • Remove extra id/strings from DB
  • Might swap crawling style from groupID to regionID (as per Valkrr's advice)
    • better quality data faster
    • current schema needs WHOLE SCRIPT to run before module data is useful
    • not as easy to clean up overwrites?
  • IT TAKES FOREVER TO GET THIS DATA!
    • ~400kills/minute, 264k kills so far... 
    • still need cruisers, frigates, shuttles, and pods

Coup de Grace

Click to embiggen